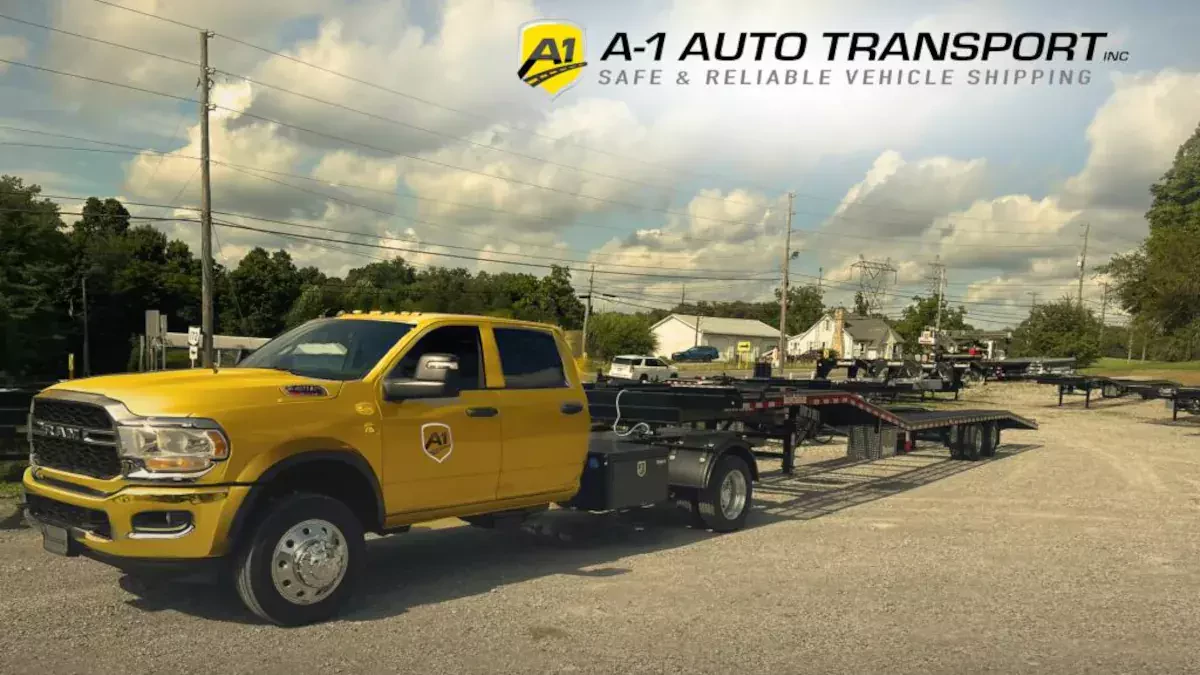
Reliable Car Transportation Services: Get Your Vehicle Moved Safely
Additionally, we provide high-end and luxury moving assistance for buyers that require careful handling, inspection, and attention to detail, depending on the season and vehicle type.
Best Transit Booking System
We understand that communication is key, so to understand clients, we provide a user-friendly booking system that enables you to communicate with each other and with us. This system ensures that all your hauling needs are met within the shortest time possible, including specific route planning to optimize the loads and area coverage so there are no delays. This solves the communication issue faced by most customers.
Now, you don't have to worry about booking appointments by phone or sending emails and waiting for a reply. Our services operate in hundreds of cities across the US, including Cincinnati, Columbus, Delaware, and many others. We also offer motorcycle conveyance assistance and snow-proof vehicles for the winter season.
Affordable Conveyance Price
Pricing can be a significant issue when it comes to auto-moving. Our pricing is affordable and tailored to your budget, and we also provide dealership delivery solutions for your products.
You can contact us for more information on our services and pricing through our phone number, and we will provide you with the latest ratings and proof of our work. You can also Get a Free Pricing Quote to haul your next vehicle.
As community residents, we understand the need for reliable and trustworthy car haulage assistance. We take pride in doing an excellent job every time, regardless of the length of the journey or the window of time for delivery.
Customer Satisfaction
Our kindnesses have been used by thousands of satisfied customers who can attest to the high quality of our work. We are the right firm for the job if you need to move your vehicle quickly to its destination or origin.
Our advanced system and commitment to excellence make us the best choice. Our Transport FAQs section can answer any questions you may have.
You can contact us from anywhere, and our A+-rated office has the solution for your shipping needs. Hurry up, book now, and your ride delivery will be the most straightforward you've ever had!
Types Of Vehicle Conveyance Solutions
The standard moving benefits include:
- Open-Air Auto Freight
- Enclosed Transit
- Terminal-to-Terminal
- Door-to-Door Transport
- Luxury, Exotic and High-End Shifting
- Electric Vehicle Shipping
When managing yourbusiness and having a reliable company, your business soloists don't have reasonable delivery assistance that can handle various situations and routes, regardless of package weight or size. Additionally, they should offer key features such as real-time tracking and scheduling options to ensure your deliveries are on time.
When choosing a delivery assistance, it is essential to business the items you are dispatching and your business needs. Some delivery benefits specialize in handling fragile or high-value items, while others excel at bulk deliveries. The exemplary Service for you will depend on your particular situation and requirements.
In addition to the standard features of reliable conveyance and on-time delivery, you may look for additional features such as parcel insurance and signature confirmation for added peace of mind. With exemplary delivery assistance, you can rest assured that your packages will arrive safely and on time, no matter what challenges may arise along the way.
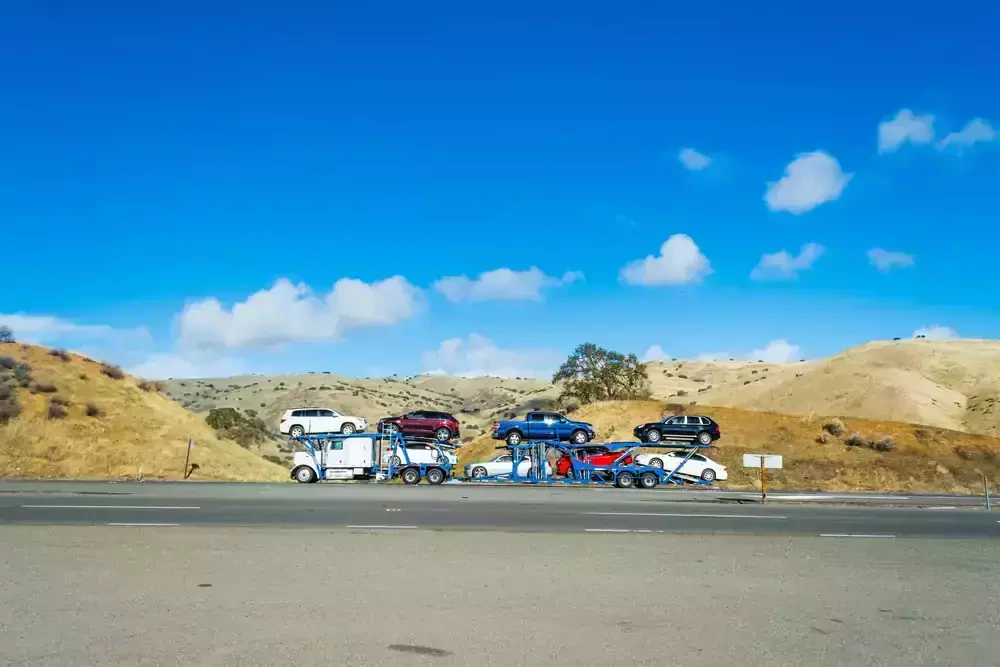
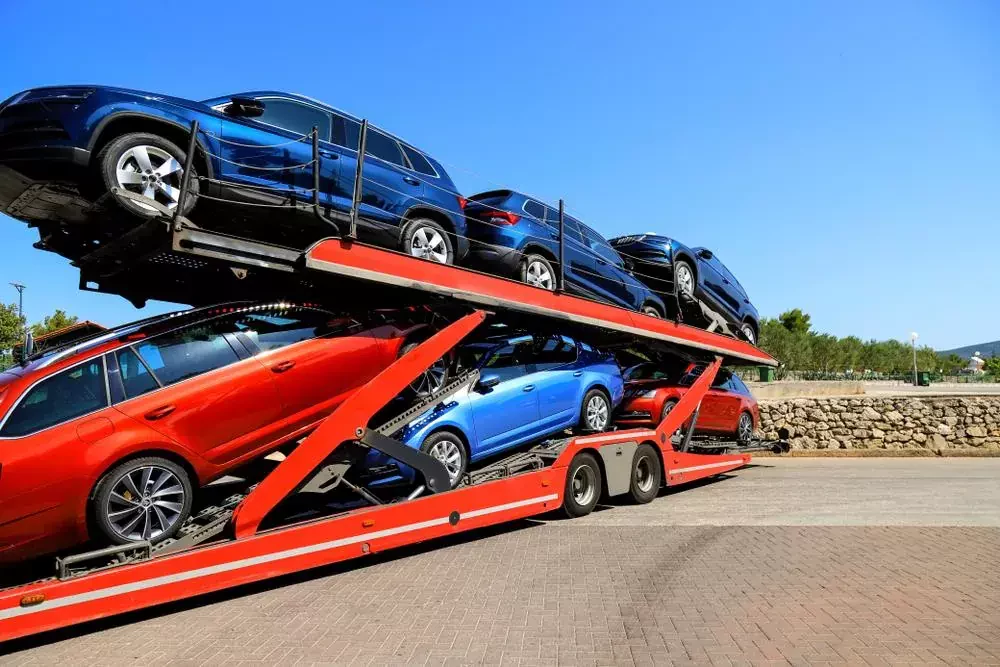
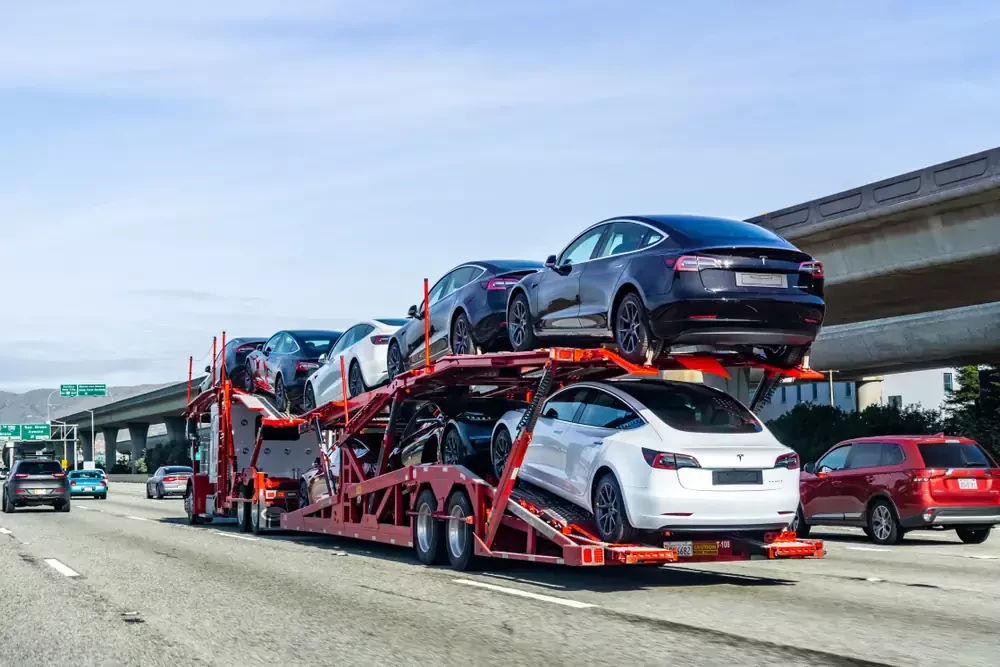
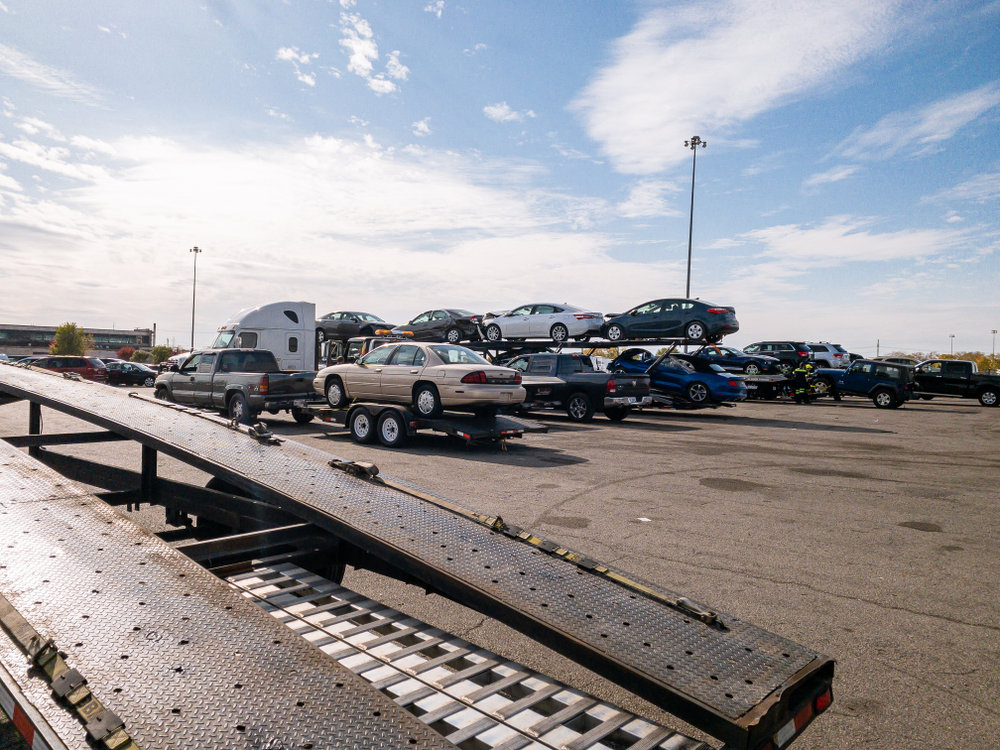
Open Carrier Hauling
Open carrier transport is the most popular and cost-effective way to ship vehicles across the country. Your car, SUV, or truck is transported on an open trailer, ensuring a fast and efficient delivery at an affordable price. This is a great option for standard vehicles and is widely used for its reliability and accessibility.
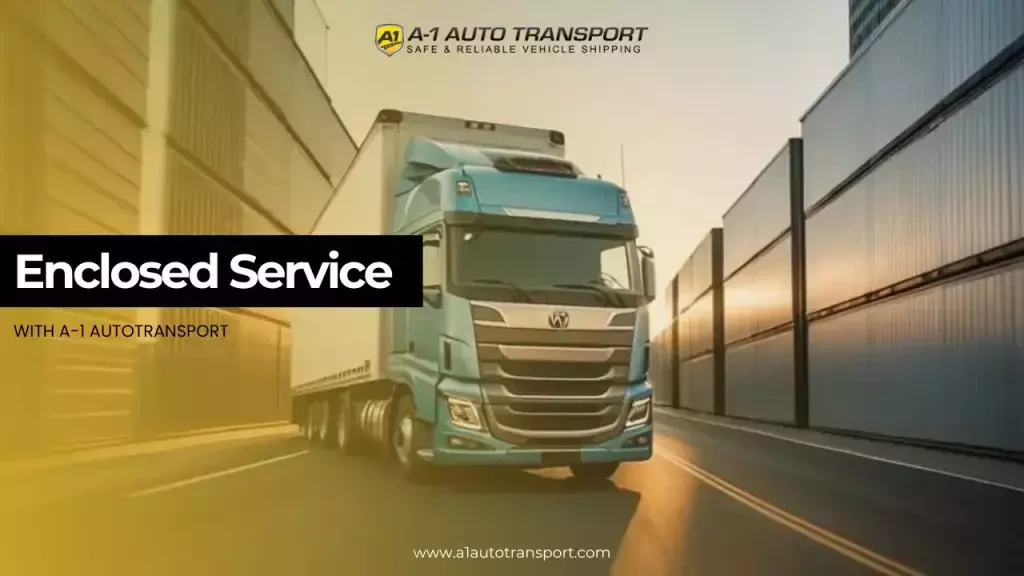
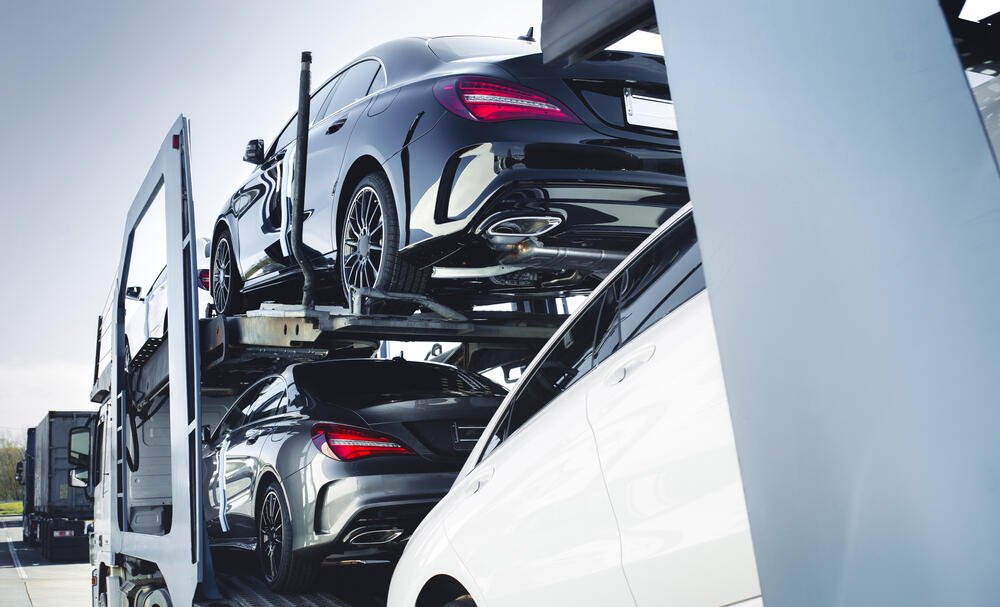
Enclosed Auto Transport
For those seeking extra protection, enclosed auto transport offers the ultimate safeguard against harsh weather and road conditions. This premium service is ideal for luxury, antique, and classic vehicles, ensuring they arrive in pristine condition. We offer two types of enclosed transport: soft-sided and hard-sided.
Soft-Sided Enclosed Transport
Soft-sided trailers are covered with durable canvas or vinyl, shielding your vehicle from dirt, debris, wind, and rain. While they provide more protection than open transport, they may not completely block out extreme weather fluctuations.
Hard-Sided Enclosed Transport
For maximum security, hard-sided enclosed transport is the gold standard. Your vehicle is fully enclosed, keeping it safe from road hazards, weather, and prying eyes—perfect for high-end or collectible cars that require extra care.
Why Choose Hard-Sided Enclosed Transport?
- Full Protection – Your car is completely sealed off, shielding it from road debris, dust, and extreme weather.
- Privacy & Security – Ideal for high-value vehicles, keeping them out of sight during transit.
- Hassle-Free Process – We handle all the paperwork and logistics, ensuring a smooth shipping experience.
Choosing between soft-sided and hard-sided transport depends on your vehicle's needs and your level of protection preference. Both options provide peace of mind throughout the shipping process.
We Ship Nationwide & Worldwide!
Get a FREE, no-obligation quote today! Click below or call 1-888-230-9116 to get started.
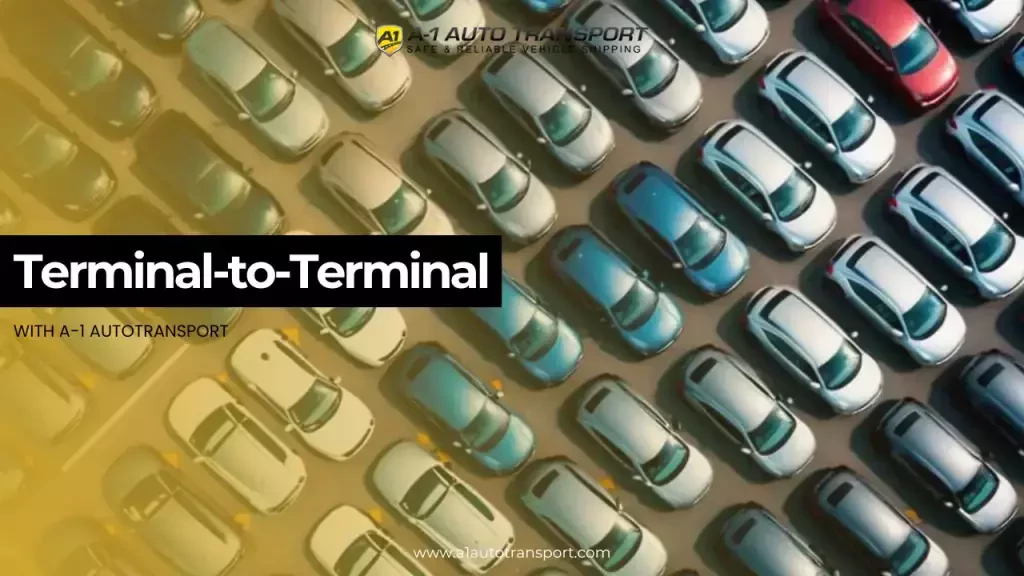
Terminal-To-Terminal
Terminal-to-terminal delivery is the industry standard for transporting vehicles. It requires the customer to drop off and pick up their car from a depot or terminal.
Open-air terminal-to-terminal delivery is the most affordable Service currently available.
To offer our customers the best, our company maintains terminals in nearly every major city in the United States. If a terminal is inaccessible, door-to-door transit is always an option.
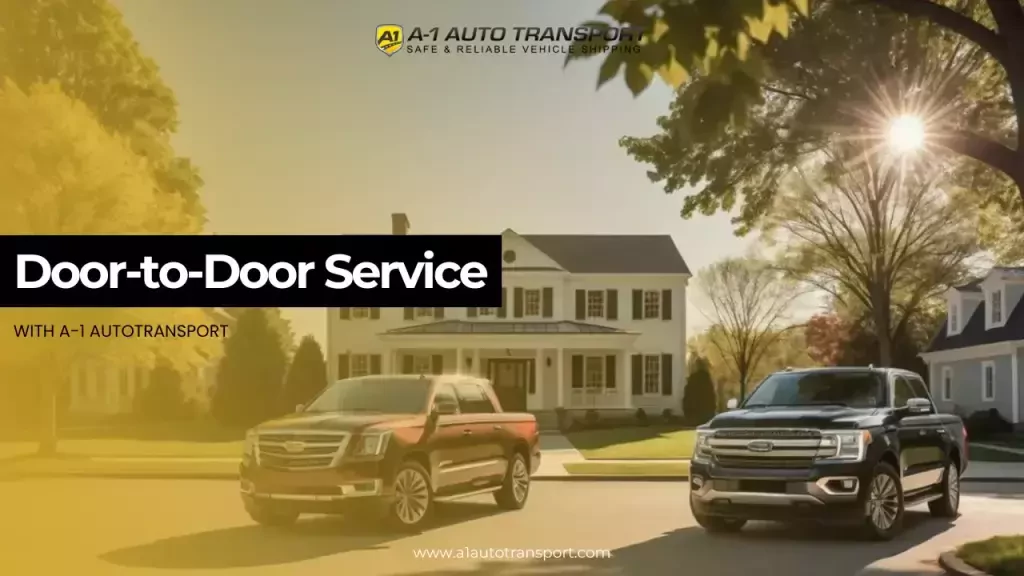
Door-To-Door Facilities
Door-to-door shifting costs more than terminal-to-terminal dispatching but can save considerable time when hauling your vehicle across the country.
Advantages Of Door-To-Door Vehicle Moving
The advantage of door-to-door vehicle donating is that you don't need to drop off or pick up your vehicle at a terminal; we do not need you. It doesn't need to be at the specified notation, and you don't need a broker.
Sometimes, our transfer carriers may encounter difficulty navigating certain areas. In such cases, we rely on the expertise of our trusted truck drivers to handle all the logistics and ensure a smooth and hassle-free conveyance experience. Our usefulness boasts a versatile fleet of specialized carriers capable of handling any logistical challenge.
If there are navigational obstacles, our experienced drivers will coordinate with you to determine the most convenient location for pickup and drop-off. Rest assured that your vehicle will be hauled safely and securely to its destination.
Exotic And Luxury Vehicles
When transporting an exotic, classic, or luxury vehicle to Hawaii, North Carolina, New York, Dayton, Los Angeles, New Mexico, Washington, California, New Jersey, West Virginia, Pennsylvania, or Illinois, you want to be sure that your vehicle will be handled with the utmost care and arrive in the same condition it was left in.
Upon request, we can even load your mobile into the first position in the shipping trailer so it does not undergo loading and unloading as other cars are added and removed safely. There's a luxury motor stay.
Luxury Vehicle Delivery Insurance
Though sending insurance and satellite tracking are standard with every quote we offer, it's essential to consider additional insurance if your vehicle is particularly valuable. This type of insurance can be provided through your existing auto insurance plan or purchased through a third-party carrier.
Assistance By Dispatching Firms For High-End Vehicles
Here are some of the benefits offered by hauling companies for high-end vehicles:
- Air ride" "suspension prevents" "huck check-in, a smoother ride, and easy haul
- Wall and floor-mounted brackets are used for a more secure fit
- Covered interior and exterior, even with enclosed easy-shift
- Hydraulic lift gate used for"t "e safest carriers''"loading and unloading possible
- Drip guards to prevent potential leaks during transit
- Equipment designed to handle a wide range of vehicle types
Affordable Vehicle Carriage Solution
Are you a veteran looking for an affordable and reliable carriage service? Look no further than our motor hauling cost calculator. Our online calculator helps you compare quotes from multiple transit companies to ensure you get the best prices for your ride loads.
With our online car shipping calculator, you can trust that your vehicle will be moved with the utmost care and delivered safely to your destination, regardless of weather conditions or other elements affecting conveyance.
Moreover, several haulers compete for your business, so you can rest assured that you get the most competitive and affordable conveyance quote. If you are a veteran, you may even be eligible for a discount on the fee. Please visit the links provided on our website for more information.
Easy Quotations
The steps provided are straightforward. Most transit quotes require customers to provide the name, model, and year of manufacture of their vehicle and the transport type. If you have any questions about the process or need any guidance, our team is always available to assist you.
The rise of online logistics calculators directly results from the ability to provide cost-effective and reliable solutions for the seamless delivery of goods to their intended destinations.
In our modern age of convenience and efficiency, delivery assistance has become an indispensable resource for individuals and businesses, providing a reason to rely on them for all their logistics needs.
Car Hauling For Students
Additionally, if you are a college student looking for a way to shift your vehicle back home during breaks, delivery can help you. The law requires that all cars being moved must be insured, and our carrying cost calculator ensures that you get the best insurance coverage available.
So, why wait? Try our online transmitting calculator today and start saving on your auto cargo!
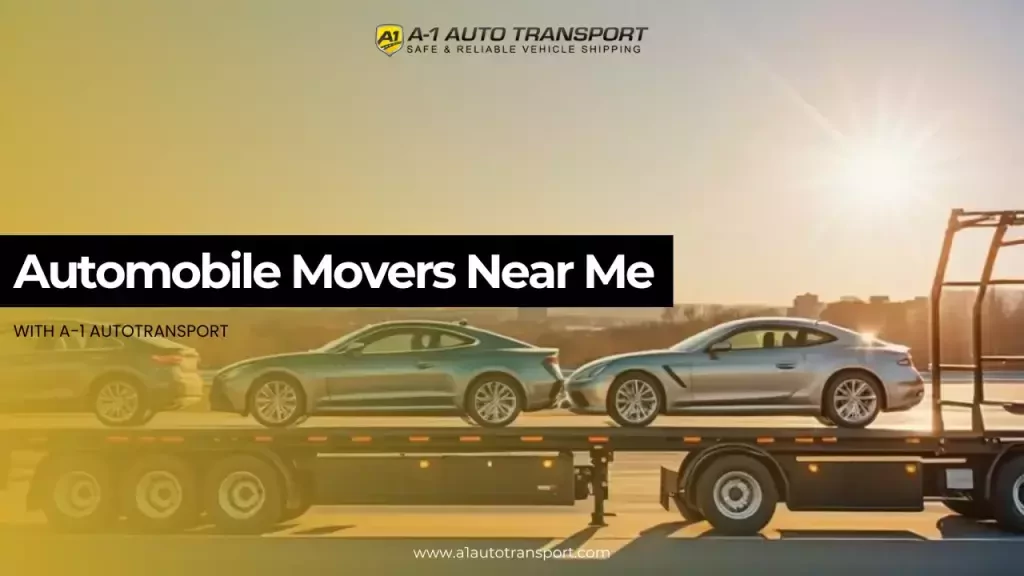
Movers Near Me
Car transporters provide convenient and reliable carriers for vehicles. These services are commonly used when moving long distances or shipping cars to different locations.
Choosing Reliable Assistance
Over 90% of users report high satisfaction with the convenience and reliability of the Usefulness.
By choosing a trusted vehicle delivery assistance, owners can rest assured that their investment is in good hands. This also frees them up to focus on other essential tasks. A professional enterprise pays close attention to even the most minor details during the conveyance process, ensuring minimal damage to the vehicle.
Easy Insurance Claims
In case of any severe damage, the insurance will cover the costs, and any damaged part of your vehicle will be repaired. You can easily file an auto transport damage claim.
Environment-Friendly Transit
Additionally, movers help reduce carbon emissions by 25% annually, making them an environmentally friendly option. If you have to travel long distances, you can choose to drive your vehicle there.
However, doing so risks accidents or other mechanical failures on the road. Depending on your destination, you might be driving for quite some time. Sure, insurance might cover the cost of damages, but all the time and effort it takes to prepare the ride for such a journey is a headache.
Missional Facilities
It is much easier to hire a professional assistant to handle everything. High-end benefits will even allow you to track the location of your vehicle and add extras to the carrier to ensure that your motor comes out as immaculately as it went in. Not only will you have that guaranteed you'll mind, but you'll also save money on the bargain and price lock promise.
Transit Categories
Motor haulage can fall under several categories depending on the moving company that moves the ride. Vehicle assistance may use several carrier methods to get a vehicle from one point to another. Among the most common methodologies are:
Rail Freight
These companies focus on transporting mobiles using the vast interconnected rail network around the US. They are either moved open-air or within car transporting a pretty quick way of getting a vehicle from one point to another that homes with. Moving an automobile comes quickly; because of the complexities of rail transit, not every delivery company offers rail freight as an option.
Air Carriers
Another type of moving assistance is air freight. This is the fastest way for transit companies to move from one place to another, regardless of where in the USS they are.
Unfortunately, air freight is expensive and may cost quite a lot, depending on where the mobile needs to fly. However, it is also the safest method of moving a vehicle, and with so many airports nationwide, it's easy to find a landing location near you.
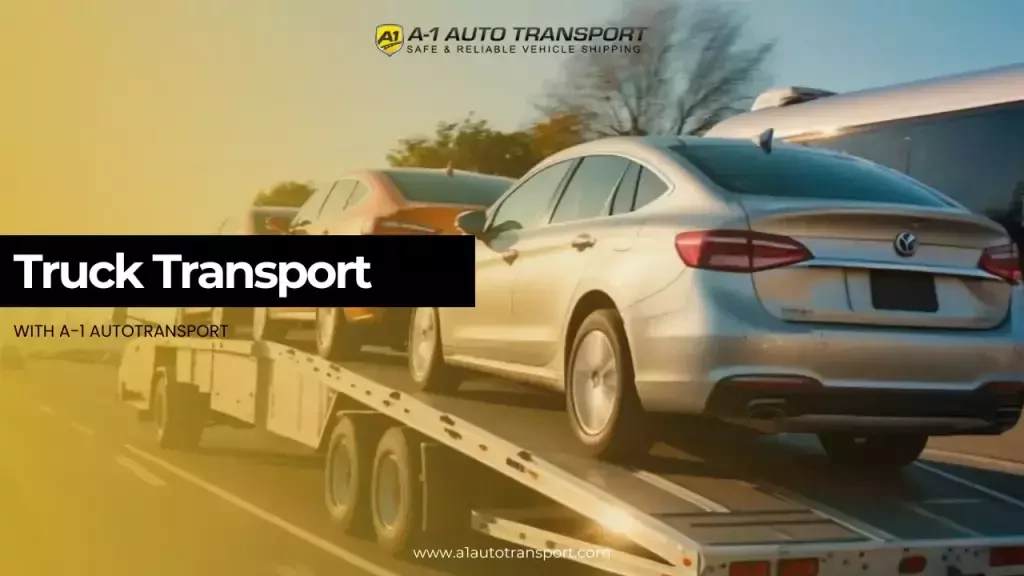
Truck Conveyance
A standard taxi is one of the most common vehicle conveyance services you'll find is a standard taxi. It's a no-frills way to move a car, and it takes a while, but the vehicle gets to its destination safely and soundly. A standard taxi is a phone number and the most convenient method of moving between locations.
Depending on the destination,, the truck can reach the final point before the owner receives the cargo, limiting the driving needed.
Vehicle Conveyance When Relocating
Considering the vast number of people currently relocating and looking for interstate car transport solutions, an invaluable asset to many moving companies. The number of people moving in the last year has risen, including those who need to move their vehicles.
The mental and emotional toll of relocation, with all its associated details, like arranging for moving expensive vehicles, can make it challenging to focus on —people who need to relocate but are unsure of how they can benefit from using mobile conveyance assistance.
Best Drivers For Relocating
Most haulers in Ohio and Cleveland also provide a concierge solution to pick up and drop off the vehicle, reducing the amount of driving the owner must do. The drivers of these vehicles are highly skilled experts who analyze the vehicle's safety.
Good vehicle delivery facilities already understand the need to deliver clients' vehicles on time. Many shifting companies offer daily updates on a car's progress to ensure the owner always knows where it is.
Choosing an auto-delivery firm is the best bet for long drives, as there is a much higher chance of something going wrong. It will ensure that the vehicle isn't driven over those massive distances.

What to Look for in a Reliable Auto Transport Company
Finding the right vehicle transport company isn’t as simple as a quick Google search. With so many options out there, choosing a provider that actually delivers on its promises takes a little research. Here’s what really matters.
Price vs. Quality
Cheap isn’t always good. Low prices often mean cutting corners, whether it’s weak insurance, slow delivery, or poor customer support. A reliable company offers fair, transparent pricing without sacrificing quality.
Reputation Matters
Reviews tell the real story. Look at Trustpilot, Google, and BBB to see what past customers say. Consistent positive feedback on safe, timely delivery and good communication is a green flag.
Licensed and Insured. No Exceptions
Any legitimate transport provider must be licensed, bonded, and insured. Before booking, check their USDOT and MC numbers. This ensures they meet industry regulations and that your vehicle is covered in case of unexpected issues.
Tracking and Communication
It’s not just about location. Proximity to a transport company doesn’t always mean better service. What really matters is their ability to keep you informed. A good company provides real-time tracking and clear updates so you always know where your car is.
Safe and Reliable Transport Options
Not all shipping methods offer the same level of protection. Open transport is great for standard vehicles, while enclosed transport is best for luxury or classic cars. The cheapest option isn’t always the safest, so choose what works best for your needs.
Customer Service and Professionalism
A company that values its customers won’t leave you guessing. They’ll answer your questions, explain their process, and provide accurate quotes without surprises or hidden fees. If they’re hard to reach or vague about their services, take that as a warning sign.
A Modern and Professional Website
A serious auto transport company should have an up-to-date, easy-to-navigate website. If their site is outdated or missing key details like service options and pricing, it’s a sign they might not be as reliable as they claim.
Ship with Confidence
Moving your car is about more than just getting it from point A to B. It’s about trust and peace of mind. Take the time to research your options, ask the right questions, and choose a company that puts your vehicle’s safety first.
Get a Free Quote Today
Need a reliable auto transport partner? Contact A-1 Auto Transport for a hassle-free experience.
📞 Call 1-888-230-9116 for a free, no-obligation quote.
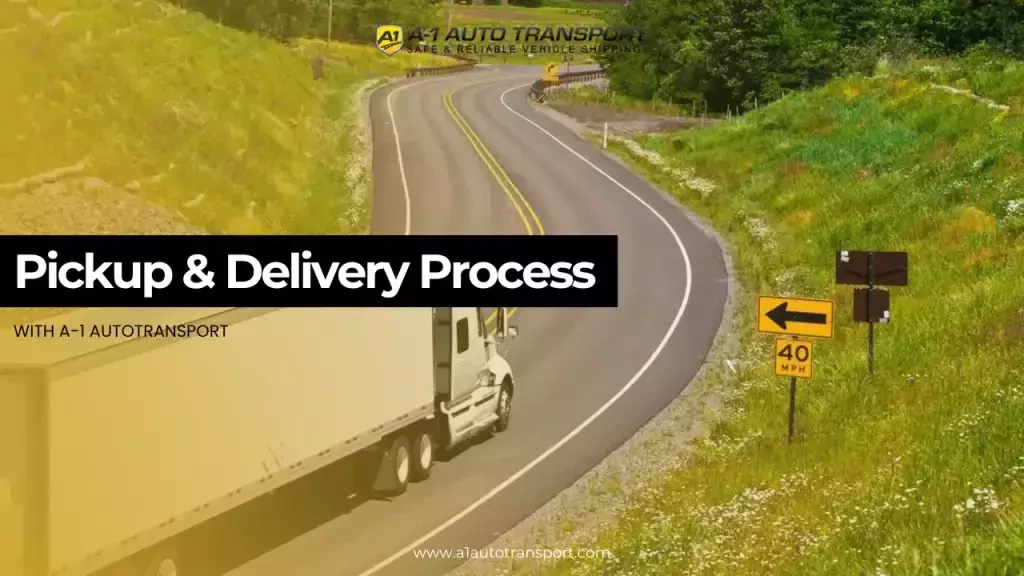
Pickup And Delivery Process
A trusted car shipping company delivery assistant will secure your vehicle to its final location. You'll be treated to regular updates on transit via phone, which will keep you informed every step of the way. If you have complaints, you can quickly contact friendly and helpful staff. The cost of your transportation solutions will vary depending on your chosen moving method.
Some methods operate faster than others, offering quicker delivery at a higher price. A delivery usefulness might even have a truck driver who will deliver your vehicle to your door. When you consult them about a quote, ask about their concierge assistance.
Ensure your delivery service provider has cargo insurance if anything happens during transit. While most auto carriers are, there's no telling what could happen. It's better to be prepared. Choosing a professional delivery solution that respects its former clients is crucial to getting the best value for your money.
Ensure the signal arrives safely by hiring a reliable transport provider like us. We offer dependable vehicle hauling solutions and provide shipping estimates.
Vehicle owners can gain a lot from using moving kindnesses. Insurance vehicles during transit, two pickup and delivery assistance around the clock, and as-you're-pocket costs are just a few perks. Moving assistance can also transfer vehicles across international borders. When you work with a professional conveyance company, you can have peace of mind knowing that your ride will arrive pristine. Professional movers use cutting-edge safety gear to safeguard your vehicle during transit.
Low-Cost Repositioning
We are an excellent choice if you need to shift cheaply. We employ a team of trained moving professionals and have offices and warehouses in major cities across the United States and worldwide. Our flexible payment options cater to students and those on a tight budget.
We transport vehicles between airports or from your door to ours, including high pickups and luxury cars. Our team is ready to assist you in scheduling your move.
Your SUVs, trucks, or motorcycles will arrive without scratches, dents, or added mileage. Upon arrival, inspect your vehicle. If you find any damage, notify the delivery representative before leaving.

Helpful Tips
Relevant Statistics
- Over 90% of car transportation assistance in major cities boasts a punctuality rate of 99.9%.
- The average wait time for a conveyance usefulness is less than 5 minutes.
- More than 80% of carrier kindness providers offer a cashless payment option.
- Conveyance usefulness has reduced carbon emissions by approximately 30% in the past decade.
- 95% of passengers using carrying benefits report feeling safe and secure during their rides.
General Facts
- Auto moving assistance provides professional moving and delivery.
- These usefulness are commonly used f or hauling vehicles across long distances, such as interstate or international loads.
- Car haulage kindnesses ensure the safety and security of vehicles during transit.
- Pickup has various options for haulage, including open transit or enclosed shifting.
- Transit benefits often provide door-to-door pickup and delivery, making it convenient for customers to dispatch their vehicles.
Frequently Asked Questions
What is the cheapest car transport service?
The cheapest car transport service is open transport, where vehicles are shipped on an open trailer, typically costing between $500 to $1,100 for sedans and $750 to $1,400 for SUVs and trucks. Booking during off-peak seasons and being flexible with pickup and delivery dates can help reduce costs.
How Far In Advance Should I Book My Transit Firm?
In general, the earlier you can schedule pick-up or delivery for your car shipment, the better. The more advanced notice you can give car transport companies, the more likely it is that the auto transporter will be able to match each step of the progress to your exact needs.
However, it is also usually possible to arrange car shipping on short notice, as well. If you’re in or near a big city, we can often arrange pick-up on the same day, often without any extra car shipping costs to you. Otherwise, we’re usually able to arrange your car delivery service within two to three days.
Will We Move My Vehicle From A Dealer?
Sure! Any time you buy an automobile, whether it’s from a private seller or a dealership that isn’t local, you have to figure out how to get your car home. It’s time-consuming to travel to pick up your car yourself and drive it home, and it often adds unnecessary mileage to your automobile.
Dealerships can set up the automobile shipping service for you, but that tends to add extra fees to your purchase price. Instead, you can work with A-1 directly, and we’ll provide you with affordable, reliable options to get your automobile.
Our shipping services are especially useful for online buyers, since traditional shipping through these platforms can be expensive.

How Long Will It Take To Shift My Vehicle?
While we try to make auto shipping as efficient as possible, there’s no set formula to determine how long it will take your automobile to arrive at your final destination, especially for long-distance or state-to-state transfers.
In this industry, federal regulations limit car transporter truck drivers to only 500 miles per day, including any stops they make to drop cars at homes or terminals. Additionally, drivers can only work six days each week. Every two weeks, they are required to take a longer break.
We arrange our routes to maximize efficiency, but truck driver unexpected circumstances, like severe weather and mechanical problems to car transporters, can arise.
However, we will provide you an estimated date of delivery and keep you informed of any changes to those dates as the information becomes available.

How Much Should I Expect To Spend?
The cost of shipping a car varies based on several factors, but on average, you can expect to pay between $500 and $1,500 for domestic transport. Shorter distances and open transport options tend to be more affordable, while long-distance and enclosed shipping cost more.
For example, shipping a sedan across a few hundred miles may cost $500 to $800, while cross-country transport for a larger vehicle can range from $1,200 to $1,500. Seasonal demand, fuel prices, and delivery preferences also affect pricing.
How Do I Decide Whether I Need Open-Air Or Enclosed Hauling?
For many drivers, the most important factor in deciding between open or enclosed is price. If you’re looking to maximize value, then open transportation is the right answer. If you want more protection for your vehicle, then you’ll want enclosed shipping.
- Open-Air Shipping
Open-air shipping saves you money, but leaves your unit exposed to the elements, like wind, rain, and potentially hail, as well as road debris and dust.
- Soft-Sided Enclosed
In this method, the transport carrier is covered by a vinyl or canvas material, offering your vehicle limited protection.
- Hard-Sided Enclosed
Hard-sided enclosed offers the highest level of protection in vehicle transportation. Your automobile will be completely enclosed in a hard-sided box, preventing weather and debris from reaching your automobile. Even better? No one can see your automobile—an added benefit if you’re moving vintage, classic, or exotic cars.
What Can I Leave In My Vehicle While It Is Being Moved?
The short answer? Nothing. The Department of Transportation (DOT) prohibits auto transport companies from moving cars that contain personal belongings, and if these items are discovered during an inspection, the carrier can be assessed a $10,000 fine.
There are other reasons, too. These extra items are not covered under the carrier’s insurance policy, creating a liability question. Car transportation trucks can only carry so much weight. Added household items can end up overloading the carrier, which can lead to fines and delays.
What Do I Need to Do To Prepare?
The first step to prepare your car for shipment is to remove any personal items. This not only ensures you’re complying with federal law, but it also limits the chance that any items will become lost during transportation.
Next, you need to make sure you have ¼ of a tank of gas or less. Any extra fuel can pose a greater than necessary fire risk and adds additional weight that can affect the overall weight of the car carrier. You should also be sure you don’t have any fluid leaks, which could pose a hazard to other vehicles.
Finally, you should remove any external parts from your car that could potentially fly off, including non-retractable antennas, bike racks, and bed liners that are not bolted to your vehicle.
Will Your Insurance Cover My Motor?
All vehicle transportation companies are required to carry insurance to cover the cars they ship. Our cargo insurance policy will cover your vehicle in the event of damage, up to the cost of full replacement during the entire time it’s in our possession.
What Kind Of Paperwork Will I Need?
When it comes to paperwork, you will always receive a copy of your bill of lading and the terms and conditions for your insurance coverage. Other documents may be required.
Your bill of lading is essentially a contract that acknowledges the condition of your vehicle at pick-up. It describes in writing where your car will be delivered to. The insurance terms spell out what level of coverage A-1 Auto Transport has and lays out the terms of that coverage.
Other documents that may be required include authorizations for lienholders or absent owners. Some states require documents like title and registration, photo IDs, and proof of personal insurance, as well.
Who Will Be Moving My Cargo?
A-1 Auto Transport started with a single tow truck in 1988. Since then, it has grown into one of the largest auto shipping companies in the U.S., handling local, interstate, and international vehicle shipping. With our many years of experience, we know how to get your car delivered safely and efficiently—and affordably.
We ensure that all members of our team embrace our mission: To get the job done right without ever cutting corners. Our core values are authority, expertise, and transparency. Our drivers embody all three of these traits.
Where Will My Load Be Picked Up/Dropped Off?
In most cases, your car will be picked up and dropped off at our terminals, which we maintain in almost every major city in the United States.
You simply arrive at our terminal, sign your bill of lading, and then rest easy knowing your car is in expert hands. Pick-up is just as easy: Bring your bill of lading and an ID, and you can get your car and quickly be on your way.
However, you can also arrange door-to-door service for an extra fee. One of our car carriers will arrive at your home, have you sign your bill of lading, then load your car onto the carrier. When the truck arrives at your new destination, your transport professional will unload the car with no fuss.
However, you should be aware that some areas are too tight for our carriers, and arrangements might need to be made to meet somewhere nearby so that the carrier is able to maneuver.
How Will I Know When My Mobile Is Being Delivered?
You should hear from one of our team members 12 to 24 hours before your car is ready to be delivered in order to set up a convenient delivery time that works for you.
While we can’t give you an exact time when your car will be ready to be delivered due to traffic, weather, and other variables, we can certainly give you a window. If a conflict comes up, we’ll contact you to update your pick-up window.
Do I Need To Be There For Pick Up Or Delivery?
Either you or a designated representative will need to be there in order to pick up or drop off your vehicle. Because you will need to sign a bill of lading once your automobile is loaded or unloaded, a responsible party needs to be there to complete the transaction.
If you aren’t able to be present yourself, you will need to contact us beforehand to let us know who you are designating to act on your behalf. That way, both you and the carrier will be protected.
Be aware, though, that if you need to change where the vehicle is being picked up or delivered after the initial order, you may be assessed additional fees.
What Kind Of Tracking Services Do You Offer?
With A-1 Auto Transport, satellite tracking is included in every quote. We know that delivering your vehicle can be stressful, even if it’s a relatively short distance. That’s why we make it as easy as possible for you to keep track of where your car is.
With satellite tracking, you can keep tabs on the progress of your vehicle as it makes its way to its final destination. While the tracking may experience disruptions due to low signal or other issues, you can rely on it to give you a general sense of where your car is along its journey.
How Long Is My Quote Good For?
In most cases, your quote is good until the end of the business day. Car shipping rates can be extremely variable, due to demand, fuel prices, and other factors beyond our control. We will do our best to honor your quote on the day you receive it. However, A-1 Auto Transport reserves the right to make adjustments to your quote if we feel it is necessary.
Is My Pick-Up Or Delivery Date Guaranteed?
As much as we would like to, we can’t guarantee any pick-up or delivery date for your vehicle, although we will do whatever we can to accommodate your needs.
If you request a specific date, we will try our best to be there without charging you an extra fee. However, we may not be able to meet that exact date, based on volume, logistics, and variables we can’t control.
If we are not able to pick up or deliver your car on the specified date, we will make every effort to arrive within 2 or 3 days to minimize any inconvenience. We will ensure that your car takes the most efficient route possible, and we’ll provide you an estimated arrival time to allow you to make plans.
What Are The Benefits Of Hauling My Vehicle Versus Driving It?
First and foremost, using car shipping companies to transport your vehicle is about convenience. There are many cases when you simply don’t have the time to drive your car as far as your final destination, such as when you start a new job on short notice.
Here are some other advantages to shipping your car:
- Less physical stress from long hours of driving
- Lower risk of getting into a car accident, especially on long trips
- Put less mileage on your car
Shipping a car also allows you to avoid the logistics and complications of a long drive.

My Four-Wheeler Still Hasn’t Arrived. Should I Be Worried?
No! If your expected delivery date has come and gone and your car still hasn’t been delivered, contact our customer service department and we’ll look into the situation. Any number of factors could have led to a delay, from mechanical problems with our car carrier to weather-related issues, including snow, hail, high winds, and flooding.
Any time our carrier experiences a delay, we will do our best to let you know so we can set up an updated delivery window. Our goal is to make transporting your vehicle as easy and stress-free as possible.
Will My Exotic or Luxury Vehicle Be Safe During Transport?
Absolutely. We prioritize the safety of every vehicle, especially high-end models that require extra care.
For maximum protection, we recommend a hard-sided enclosed carrier to shield your car from weather, road debris, and unwanted attention. This ensures a secure, damage-free journey.
We also use hydraulic lift gates for smooth loading and unloading, minimizing handling risks. If needed, we can position your car strategically within the carrier to reduce unnecessary movement.
While your vehicle is fully insured, owners of classic or ultra-high-value cars may consider additional coverage for extra peace of mind. Protecting your investment is our top priority.
How Do I Pay?
We offer flexible payment options to make the process easy for you. If you're unsure about the best method, give us a call and we’ll be happy to help!
Will You Pick Up Vehicles That Don’t Run?
Absolutely! While these cars do need specialized equipment and typically come with some extra costs, usually between $50 to $100, it's important to remember that even if your car’s engine starts, it might still be classified as non-running if it can’t be driven safely. Some examples of this could be a vehicle with brake issues or steering problems.
You might want to transport a car that doesn’t run for several reasons. Most of the time, these cars have either financial or sentimental value, and owners want to transport them so they can repair them to running condition.
Please inform us if your car is not running while making your arrangements. This way, we can send the appropriate equipment and give you an accurate quote.
Do You Shift Vehicles Internationally?
Yes, we do! We’ve been shipping cars internationally for more than 20 years, so we know the process. Every country has its own method for importing vehicles to the country, and our team of professionals will make sure you get through the process with as little stress as possible.
Should I Expect Any Extra Charges Once My Four-Wheeler Is Delivered?
At A-1 Auto Transport, we believe in transparent pricing with no hidden fees. You only pay for the services you choose, with no unnecessary upsells or extra charges.
Who Is Vehicle Delivery Intended For?
Everyone! Shipping your car is safe, convenient, and affordable. It is available to anyone who’s interested.
Here are some of the common reasons that people choose to hire car shipping companies:
- Relocation for a new job
- Bought a car online from a distant seller or at a car auction
- Moving due to military orders
- A single person trying to move multiple cars to a new home
- Avoiding a long, tiring trip
- Transporting classic cars
- Starting college
- Going on vacation
If you’re not sure whether shipping your vehicle is right for your situation, contact one of our experts. We will help you to decide if auto transportation services will work well for you.
What Are The Different Types Of Dispatching?
Auto transport dispatching refers to how vehicles are assigned to carriers for shipment. Here are the main types:
- Open Dispatching assigns cars to available carriers on open trailers. This common, cost-effective method exposes vehicles to the elements.
- Enclosed Dispatching – Vehicles are matched with enclosed carriers, offering extra protection from weather and road debris. Ideal for luxury, classic, or high-value cars.
- Dedicated Dispatching means that a specific carrier is dedicated to transporting just one vehicle or a few cars. This option gives you greater control over the process and ensures faster shipping, although it does come with a slightly higher cost.
- Expedited Dispatching – Prioritizes fast delivery by quickly matching vehicles with the nearest available carriers. Ideal for urgent shipments but comes at a premium.
- Terminal Dispatching – Vehicles are stored at a terminal until a carrier is assigned. This budget-friendly option may take longer.
- Door-to-Door Dispatching – This represents the most convenient method in which a carrier is designated to collect and deliver the vehicle at the designated locations.
The best dispatching method depends on your budget, timeline, and the level of protection needed for your vehicle.
What Are The Factors That Affect The Cost Of Auto Delivery?
Several key factors determine how much you'll pay to ship a vehicle. Distance is the biggest driver since longer routes cost more due to fuel, time, and labor. The type of transport matters too. Open carriers are the most affordable but expose your car to the elements, while enclosed shipping offers maximum protection at a premium price. Vehicle size and weight also impact cost since larger, heavier cars require more space and fuel. Seasonality plays a role, with summer and winter being peak times when demand and prices tend to rise. Your pickup and drop-off locations also affect pricing, since remote areas may cost more due to limited carrier availability. Finally, insurance coverage adds another layer. Basic coverage is standard, but higher-value vehicles may need extra protection, increasing the total cost. Understanding these factors helps you plan smarter and avoid surprises when shipping your car.
What Should I Do If My Vehicle Is Damaged During Moving?
If your car is damaged during shipping, you should contact the auto shipping company immediately. The company will be responsible for the cost of repairs. Here are the steps you should take:
- Inspect your car: As soon as you receive your car, inspect it thoroughly for any damage. Take pictures of any damage you find.
- Contact the auto shipping company: Contact the auto shipping company and notify them of the damage. They will send a representative to inspect the damage.
- File a claim: The auto shipping company will file a claim with their insurance company. The insurance company will investigate the claim and determine if the company is liable for the damage.
- Get your car repaired: If the insurance company finds the company liable, they will pay for the repairs to your car.
Does It Cost Extra For A Vehicle Hauler To Transit An Inoperable Vehicle?
Yes, it typically costs extra for a car shipper to transport an inoperable vehicle. This is because inoperable vehicles require more time and effort to load and unload, and they may also require special equipment.
Here are some of the reasons why it costs extra to ship an inoperable vehicle:
- Special equipment: Inoperable vehicles may require special equipment to load and unload, such as a forklift or a winch. This equipment can be expensive to rent or purchase.
- More time: It takes more time to load and unload an inoperable vehicle than a running vehicle. This is because the shipper has to be more careful not to damage the vehicle.
- Increased risk: There is an increased risk of damage to an inoperable vehicle during shipping. This is because the vehicle is not running and cannot be driven off the truck if it starts to shift.
The amount of extra cost for shipping an inoperable vehicle will vary depending on the specific circumstances. However, it is important to factor this cost into your budget if you are considering shipping an inoperable vehicle.
How Much Does Online Shifting Cost From Vehicle Pickup To Delivery?
The average cost of shipping a car is around $1,200. However, the cost can range from $500 to $2,500 or more, depending on the Distance, Type of auto shipping, Size and weight of the car, Time of year and Demand for auto shipping.

 Share on Facebook
 Share on LinkedIn
 Share on Twitter


 Google
  Instagram