Oil Price Shocks & Vehicle Shipping Costs: U.S. Statistics (2026)

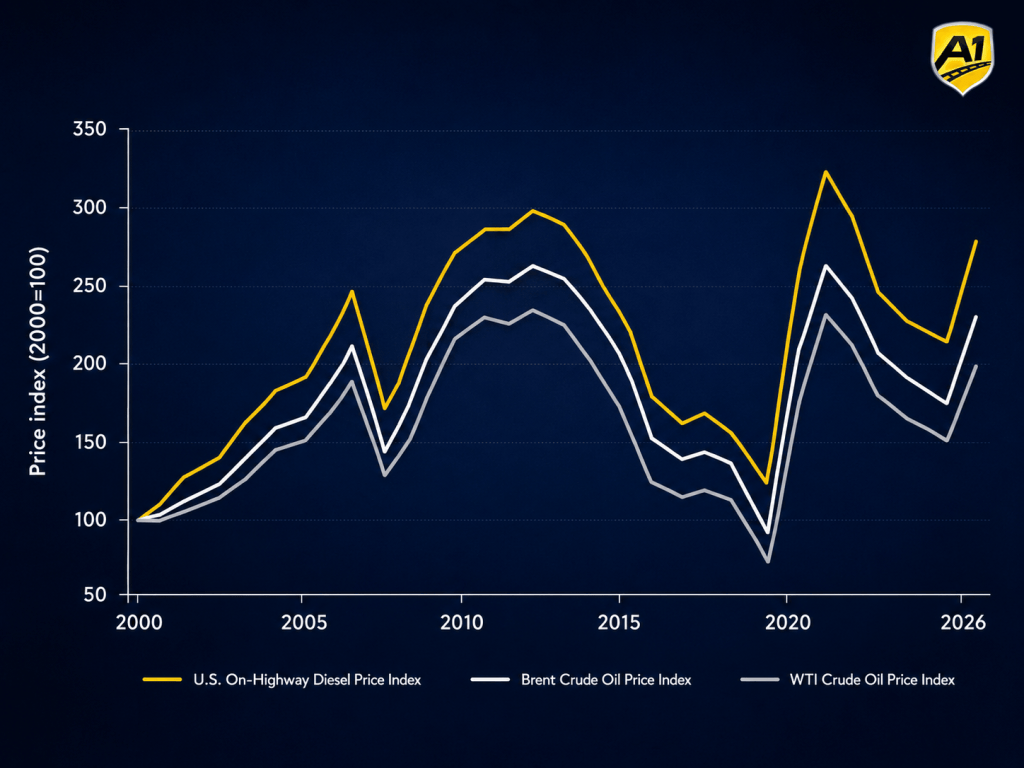
U.S. Diesel and Crude Oil Price Trends
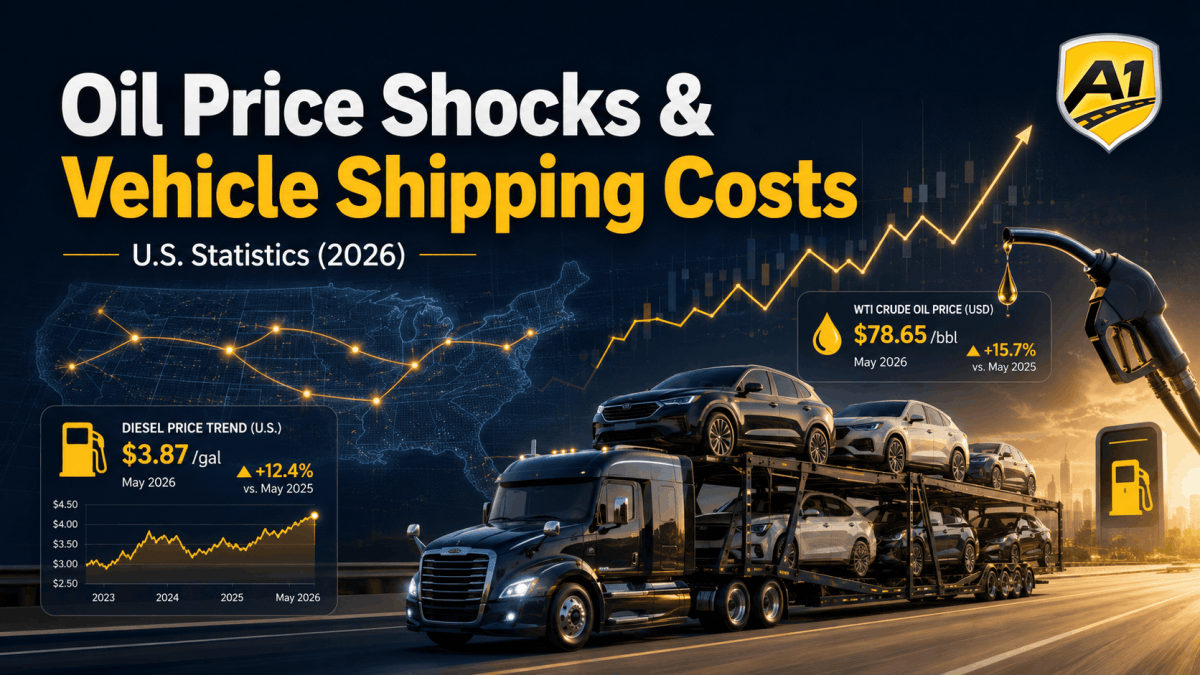
U.S. vehicle shipping costs are closely tied to diesel because most long-distance auto transport carriers operate diesel-powered equipment. Crude oil shocks do not pass through one-for-one, but they can quickly raise diesel costs and increase pressure on carrier operating expenses.
- U.S. on-highway diesel averaged $3.66 per gallon in 2025, after easing from the 2022 fuel spike.
- Monthly diesel reached $5.60 per gallon in May 2026, placing it about 53% above the 2025 annual average.
- Brent crude averaged $69.14 per barrel in 2025, compared with $100.93 per barrel in 2022 during the Russia-Ukraine oil shock period.
- Brent crude rose to $117.29 per barrel in April 2026, before easing to $107.14 per barrel in May 2026.
- Diesel remained elevated even after crude softened, showing how refinery margins and product-specific supply pressure can extend fuel cost stress.
- EIA reported that 2026 wholesale petroleum product price increases were tied partly to supply concerns around the Strait of Hormuz, with diesel among the affected products.
- For vehicle shipping, diesel volatility matters most on long-haul routes, where fuel cost is multiplied across hundreds or thousands of loaded miles.
New Deals are now available for shipping all types vehicles using our vetted reliable shippers. Compare price estimates & Unlock up 25% off.
Major Oil Price Shock Events Since 2000
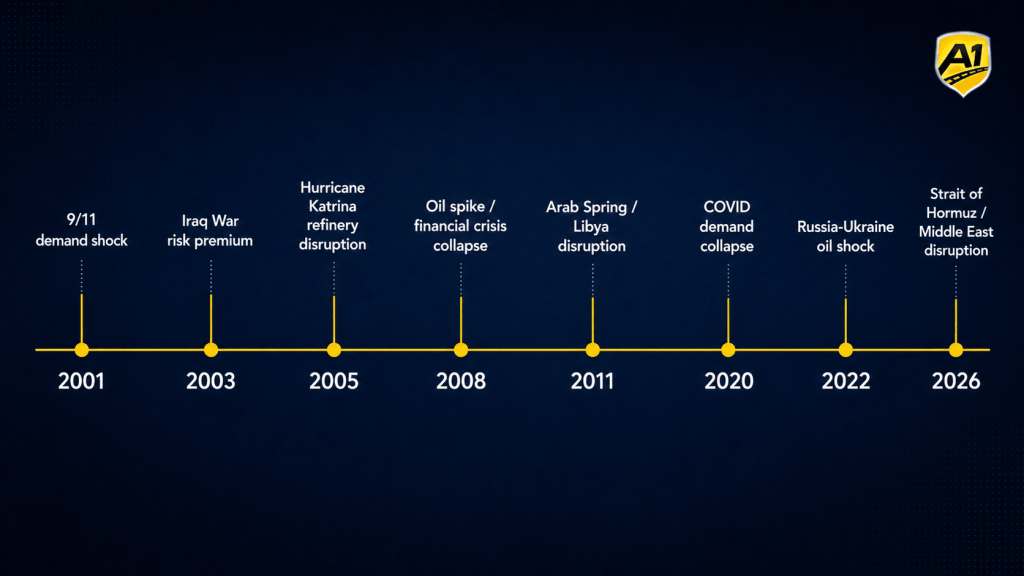
Major oil price shocks have repeatedly affected U.S. diesel markets, but the direction and intensity of each shock depends on whether the event disrupted supply, demand, refining capacity, or global trade routes. For vehicle shipping, supply-driven shocks are usually the most important because they can raise diesel costs quickly.
- The 2001 demand shock after 9/11 reduced travel and freight activity, contributing to weaker oil demand rather than a sustained fuel-price spike.
- The 2003 Iraq War period added geopolitical risk to crude markets, increasing uncertainty around global oil supply.
- Hurricane Katrina in 2005 disrupted Gulf Coast refining capacity, creating sharp pressure on U.S. fuel supply and diesel pricing.
- The 2008 oil shock pushed crude prices to historic highs before the financial crisis caused a rapid collapse in demand.
- The 2011 Arab Spring and Libya disruption tightened crude supply and contributed to higher global oil prices.
- The 2020 COVID demand collapse sharply reduced fuel consumption before freight and consumer demand rebounded unevenly.
- The 2022 Russia-Ukraine oil shock raised crude and diesel prices across global markets, creating one of the strongest fuel-cost pressures for U.S. transport operators.
- The 2026 Strait of Hormuz and Middle East disruption window added renewed supply-risk pressure to crude and diesel markets.
Oil shocks affect vehicle shipping most when they raise diesel prices faster than carriers can adjust routes, scheduling, equipment utilization, and fuel surcharge formulas.
Fuel Share of Truck Operating Costs
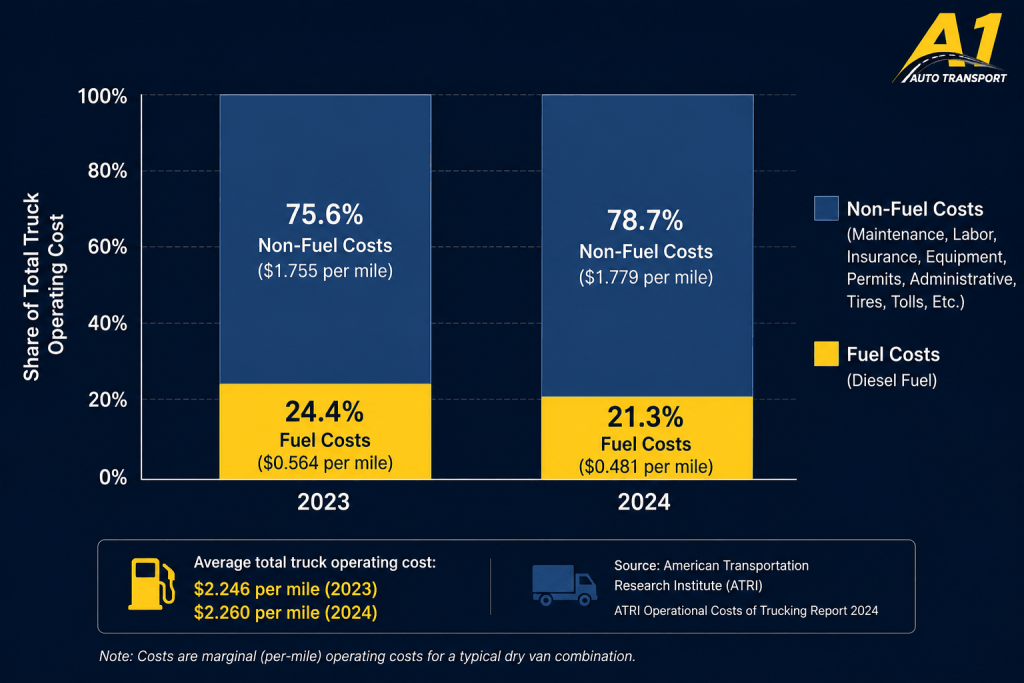
Fuel is one of the largest variable costs in vehicle shipping because long-distance auto transport depends on diesel-powered carrier trucks. Even when crude oil prices move first, diesel cost changes are what directly affect carrier operating expenses.
- ATRI reported the average marginal cost of operating a truck at $2.260 per mile in 2024.
- Non-fuel truck operating costs averaged $1.779 per mile in 2024, leaving an implied fuel component of about $0.481 per mile.
- Based on those figures, fuel represented roughly 21.3% of total truck operating cost in 2024.
- In 2023, fuel represented about 24.4% of total operating cost, showing how fuel share expands during higher-price periods.
- Fuel costs are more volatile than fixed expenses such as equipment payments, insurance, permits, and administrative costs.
- For auto transport carriers, fuel exposure increases on longer routes, low-density lanes, and trips with limited backhaul opportunities.
- Diesel volatility can pressure both carrier margins and customer-facing shipping prices, especially when price spikes occur quickly.
Fuel share does not explain the full price of vehicle shipping, but it is one of the clearest channels through which oil shocks reach transport markets.
Diesel Prices and Freight Rate Pressure
Diesel price changes do not automatically move vehicle shipping prices at the same rate, but public freight data shows a measurable relationship between fuel volatility and transportation pricing. For auto transport, this relationship is strongest on long-distance routes where diesel exposure is higher.
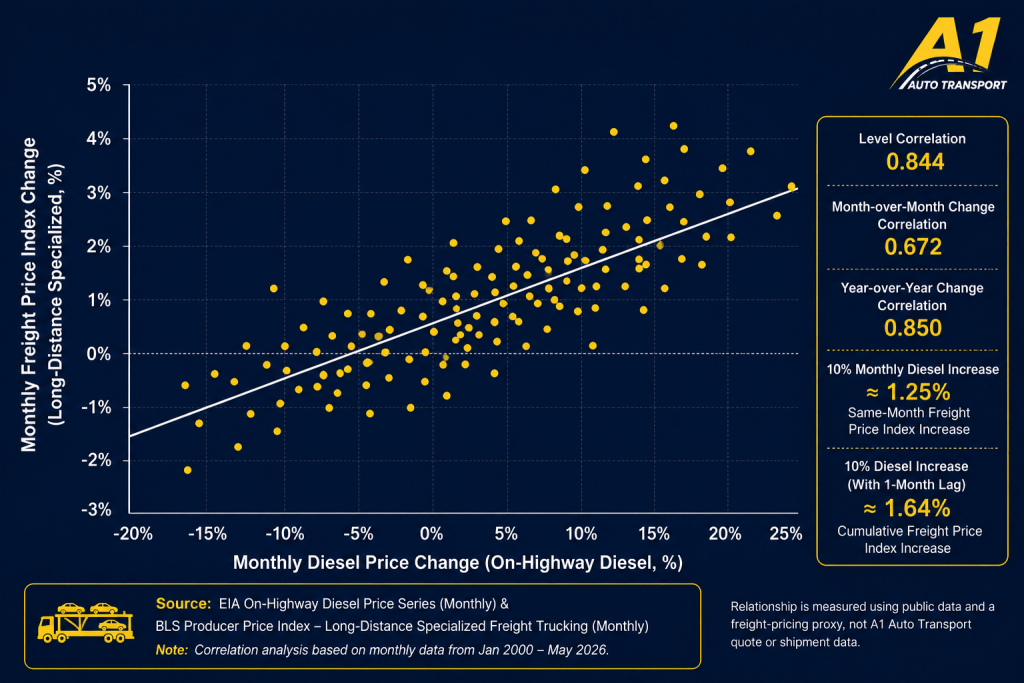
- Monthly diesel prices and long-distance specialized freight pricing showed a strong historical relationship, with a level correlation of about 0.84.
- Year-over-year diesel changes and freight price changes showed a similar relationship, with correlation near 0.85.
- Month-to-month diesel changes had a weaker but still meaningful relationship with freight pricing, with correlation near 0.67.
- A 10% monthly diesel price increase was associated with about a 1.25% same-month increase in the freight price index.
- When including a one-month lag, a 10% diesel shock was associated with roughly a 1.6% cumulative freight-price response.
- Freight pricing often reacts with a delay because carriers adjust rates, surcharges, lane planning, and available capacity after fuel changes occur.
- This analysis uses public freight-pricing indexes as a proxy, not private A1 Auto Transport quote data.
The relationship is measurable, but not one-for-one. Diesel is a major cost input, while final shipping prices also reflect labor, equipment, insurance, demand, route density, and carrier availability.
Fuel-Only Cost Impact on Common Vehicle Shipping Routes
Fuel shocks affect longer vehicle shipping routes more because diesel cost is multiplied across total loaded miles. These estimates isolate the fuel-only impact, meaning they do not include labor, insurance, equipment, tolls, permits, or carrier availability.
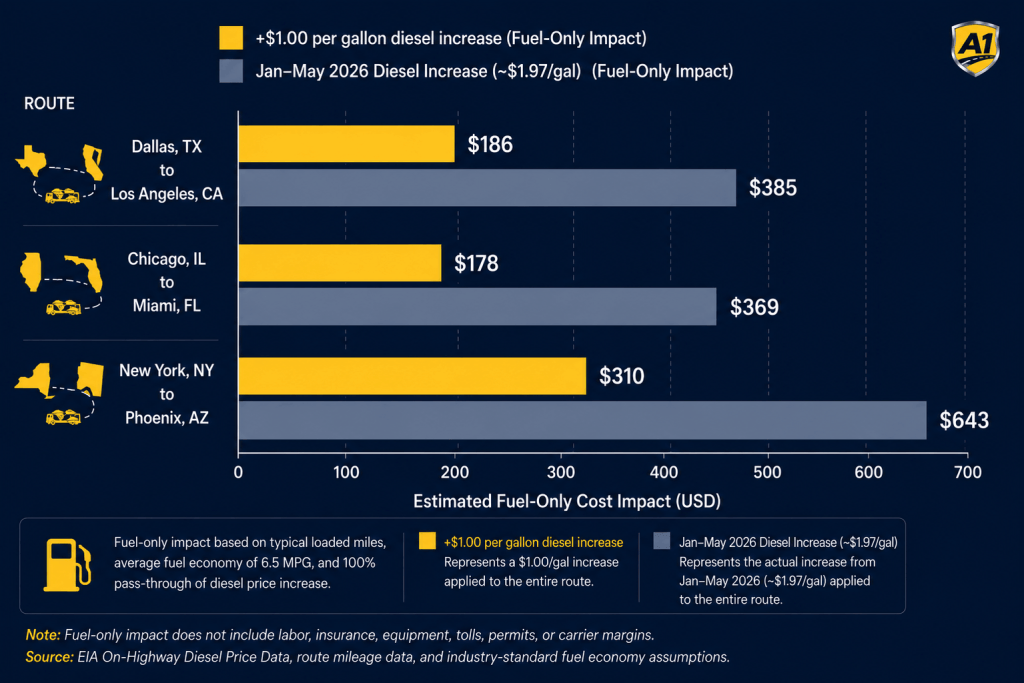
- A $1.00 per gallon diesel increase can add about $186 in fuel cost on a Dallas to Los Angeles vehicle shipping route.
- The same $1.00 diesel increase can add about $178 in fuel cost on a Chicago to Miami route.
- A longer New York to Phoenix route can see about $310 in added fuel cost from a $1.00 per gallon diesel increase.
- Under a larger diesel shock similar to the January to May 2026 increase, the fuel-only impact could reach about $385 on Dallas to Los Angeles.
- The same shock could add about $369 in fuel-only cost on Chicago to Miami.
- New York to Phoenix shows the highest exposure among the sample routes, with an estimated $643 fuel-only impact under full pass-through assumptions.
- These figures show why long-haul routes are more sensitive to diesel volatility than shorter regional shipments.
Fuel-only estimates help isolate the energy-cost component of vehicle shipping, but final customer prices also depend on demand, trailer availability, route density, timing, and carrier margins.
Regional Diesel Price Differences
Diesel price exposure is not equal across the United States. Regional supply chains, refinery access, state fuel taxes, environmental fuel rules, and distance from major production hubs can create wide differences in operating costs for vehicle shipping carriers.
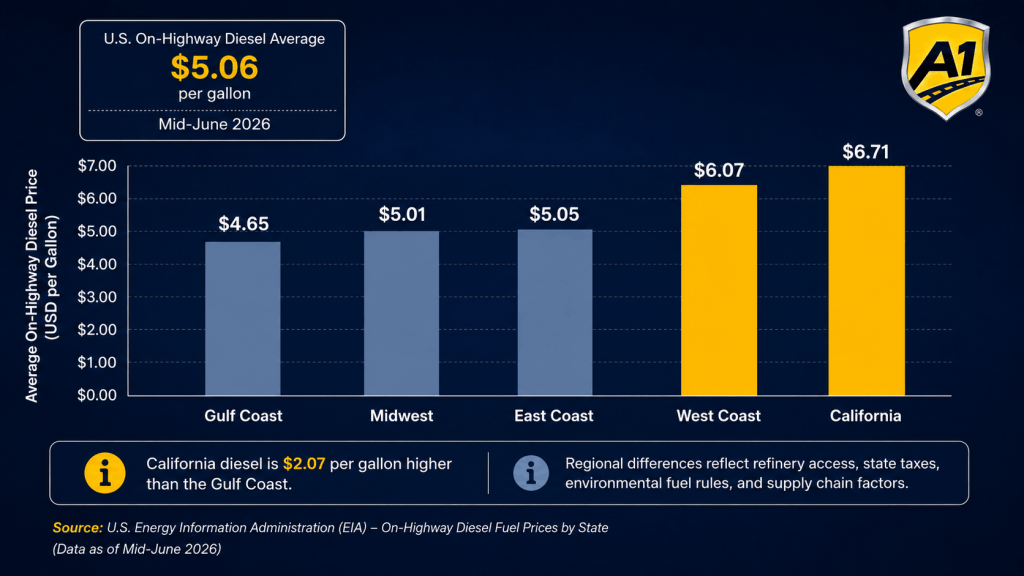
- The U.S. on-highway diesel average reached about $5.06 per gallon in mid-June 2026.
- The Gulf Coast had one of the lowest regional diesel averages at about $4.65 per gallon.
- The Midwest averaged about $5.01 per gallon, close to the national average.
- The East Coast averaged about $5.05 per gallon, also near the national average.
- The West Coast averaged about $6.07 per gallon, making it one of the most fuel-sensitive regions for long-distance transport.
- California diesel averaged about $6.71 per gallon, roughly $2.07 higher than the Gulf Coast.
- Higher regional diesel prices can raise carrier costs on West Coast lanes, especially for long-haul routes entering or leaving California.
Regional diesel gaps matter because vehicle shipping prices are shaped by the fuel costs carriers actually face on specific lanes, not only the national average.
Fuel Surcharges and Pass-Through Pressure
Fuel surcharges are one of the main ways diesel volatility moves through freight and vehicle shipping markets. They do not always reflect the full cost impact immediately, but they help carriers adjust pricing when diesel prices rise quickly.
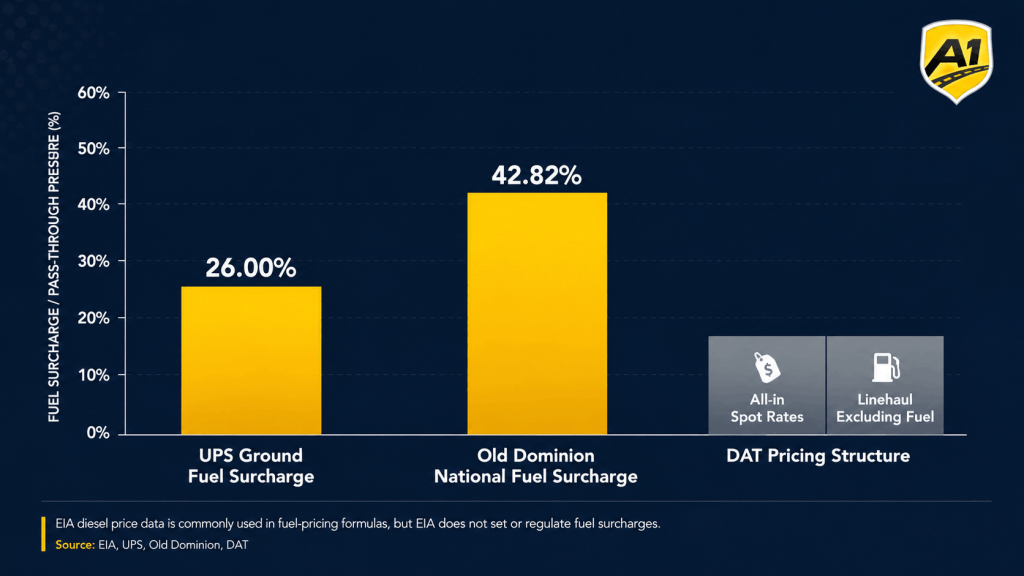
- EIA diesel price data is commonly used by shippers and carriers as a benchmark in fuel-pricing formulas.
- EIA publishes diesel price data, but it does not calculate, regulate, or enforce fuel surcharges.
- Public freight surcharge examples show how diesel volatility can translate into large percentage adjustments on transportation invoices.
- UPS listed a 26.00% ground fuel surcharge effective June 22, 2026.
- Old Dominion listed a 42.82% national fuel surcharge as of June 17, 2026.
- DAT separates all-in spot rates from linehaul rates excluding fuel, showing that fuel is often tracked as a distinct pricing component.
- Vehicle shipping quotes may reflect fuel pressure through direct surcharges, higher carrier bids, or reduced capacity on low-margin routes.
Fuel pass-through is not uniform across the market. It depends on contract terms, lane density, diesel movement, carrier availability, and how quickly fuel benchmarks change.
Key Takeaways
- Oil price shocks affect vehicle shipping through diesel costs, not directly through crude oil prices alone.
- Diesel is one of the largest variable costs for auto transport carriers, representing roughly one-fifth to one-quarter of truck operating costs in recent years.
- Freight pricing data shows a measurable relationship between diesel volatility and long-distance specialized freight rates, although the pass-through is not one-for-one.
- Long-distance vehicle shipping routes are more exposed to fuel shocks because diesel cost compounds across loaded miles.
- Regional diesel differences matter, with West Coast and California fuel prices creating higher cost exposure than Gulf Coast lanes.
- Fuel surcharges are a common pass-through mechanism, but they vary by carrier, contract structure, timing, and market conditions.
- The strongest press angle is that fuel shocks create measurable cost pressure across U.S. vehicle shipping, especially on long-haul and high-fuel-cost regional lanes.

 Share on Facebook
 Share on LinkedIn
 Share on Twitter
 Google
  Instagram
  BBB
BBB