State-to-State & Interstate Car Shipping Statistics (2026)

Average State-to-State Car Shipping Costs (U.S.)
State-to-state car shipping costs in the U.S. vary primarily by distance, route density, and carrier availability. Based on aggregated interstate shipment data from 2023–2025, pricing follows consistent distance-based patterns rather than flat-rate averages. The figures below reflect standard open-carrier transport, which accounts for the majority of U.S. vehicle shipments according to FMCSA-registered carrier activity.
Key Statistics: Average Interstate Car Shipping Costs
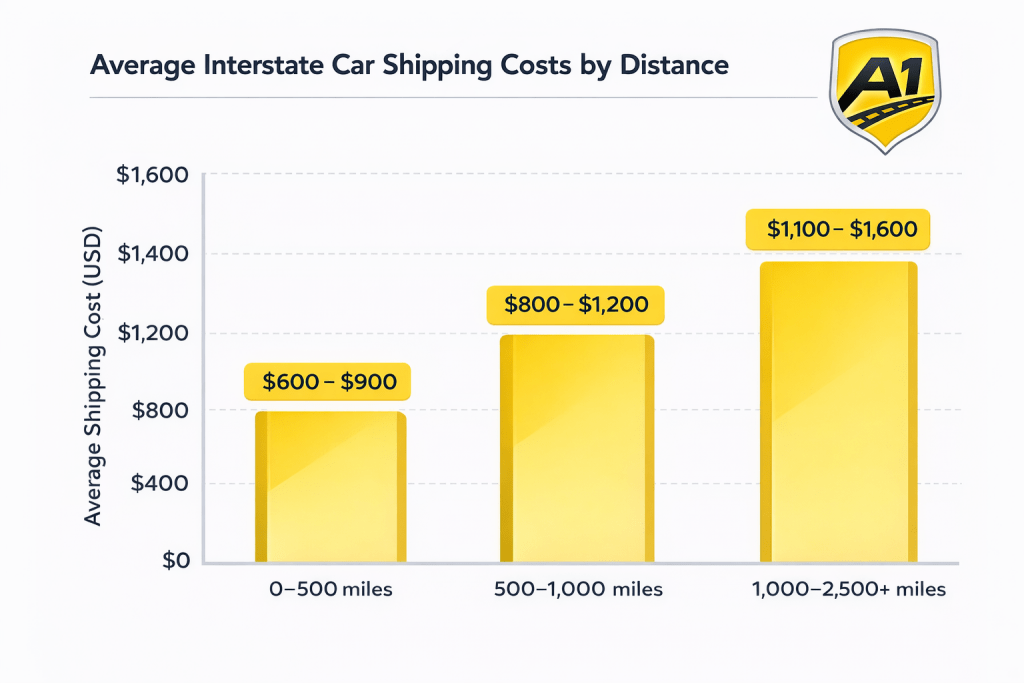
- Short-distance shipments (0–500 miles) typically range between $600 and $900, with higher per-mile costs due to fixed pickup and delivery overhead.
- Mid-distance shipments (500–1,000 miles) average $800 to $1,200, representing the most common pricing range for interstate moves within adjacent regions.
- Long-distance shipments (1,000–2,500+ miles) generally cost between $1,100 and $1,600, depending on route efficiency and seasonal demand.
- Cross-country state-to-state shipments averaging 2,500–3,000 miles commonly settle around $1,300 to $1,500 for open transport, based on nationwide carrier quote aggregation.
- Open-carrier pricing remains the baseline for interstate transport, with enclosed shipping typically adding 40–60% to total cost due to limited carrier capacity and lower load density.
- Pricing variability increases during peak summer months, where identical routes may see cost fluctuations of 20–30% compared to winter shipping periods, according to industry shipment trend analysis.
What Drives These Cost Ranges
- Fixed logistics costs (dispatch, loading, unloading) impact short routes more heavily.
- Longer routes benefit from distance efficiency, lowering average cost per mile.
- High-volume corridors between major states maintain more stable pricing due to consistent carrier flow.
- Seasonal relocation cycles significantly influence availability and rate compression.
Car Shipping Cost per Mile Benchmarks (U.S.)
Interstate car shipping costs in the U.S. decrease on a per-mile basis as distance increases. This pricing behavior reflects carrier efficiency, route optimization, and fixed logistics costs that impact short-distance shipments more heavily. Aggregated shipment data from 2023–2025 shows a consistent downward cost-per-mile trend across distance brackets.
Key Statistics: Average Cost per Mile for State-to-State Car Shipping
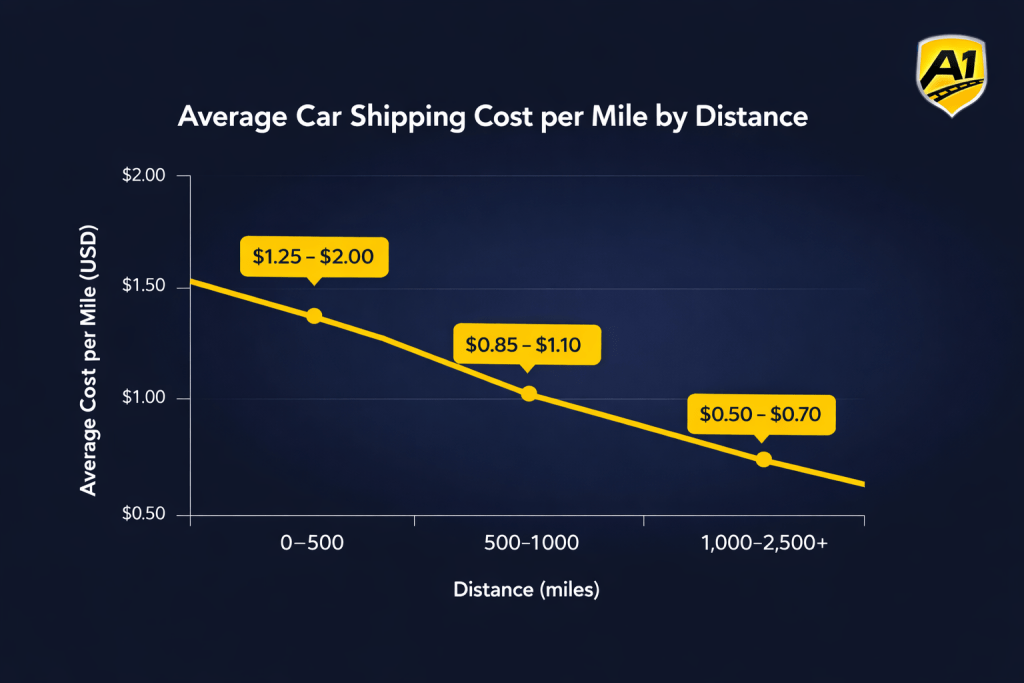
- Short-distance shipments (0–500 miles) average between $1.25 and $2.00 per mile, driven by fixed pickup and delivery costs that are spread across fewer miles.
- Mid-distance shipments (500–1,000 miles) typically range from $0.85 to $1.10 per mile, representing the most balanced cost efficiency for interstate transport.
- Long-distance shipments (1,000–2,500+ miles) commonly fall between $0.50 and $0.70 per mile, as carriers maximize route efficiency over extended distances.
- Cross-country state-to-state shipments exceeding 2,500 miles often approach $0.50–$0.60 per mile under standard open-carrier conditions.
- Cost-per-mile rates remain lowest on high-volume corridors between major states, where consistent carrier flow reduces deadhead mileage.
- Seasonal demand affects total pricing more than per-mile efficiency, meaning long routes retain cost advantages even during peak months.
Why Cost per Mile Declines with Distance (Dataset Context)
- Dispatching, loading, and unloading costs are largely fixed, regardless of trip length.
- Longer routes allow carriers to distribute these fixed costs over more miles.
- Multi-state corridors support better route chaining and fewer empty return trips.
- Carrier competition is stronger on long-haul routes, stabilizing per-mile pricing.
Interstate Car Shipping Delivery Times by Distance (U.S.)
Interstate car shipping delivery times in the U.S. are primarily determined by distance, route density, and carrier scheduling constraints. Based on aggregated carrier transit data from 2023–2025, most auto transport routes follow predictable mileage-to-time ranges rather than fixed delivery dates. The timelines below reflect average transit durations after pickup, not booking lead time.
Key Statistics: Average Interstate Car Shipping Delivery Times
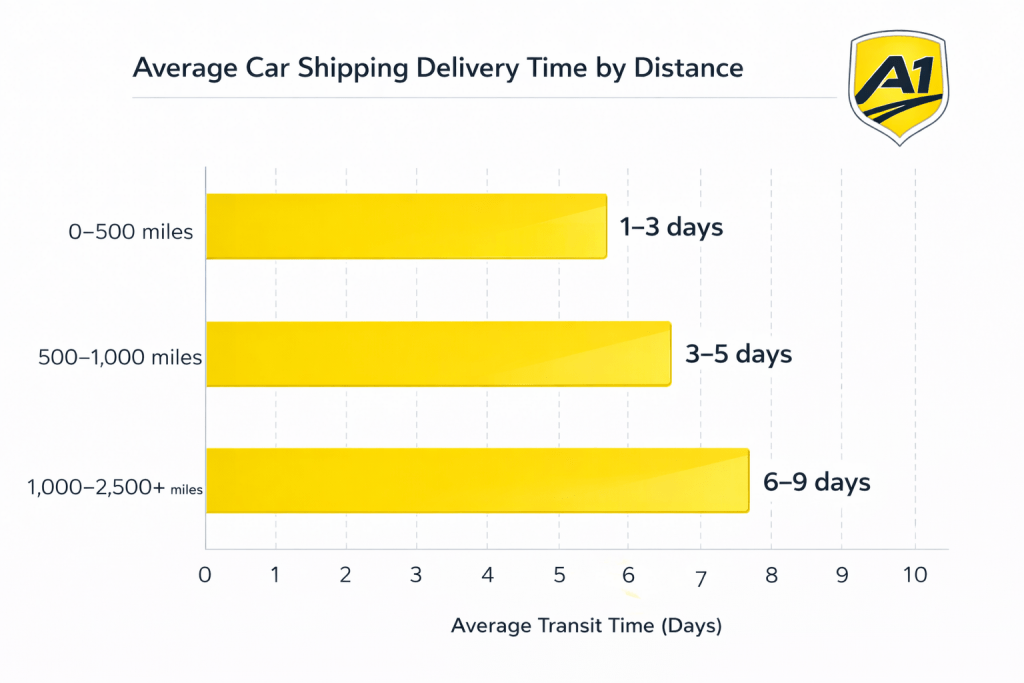
- Short-distance shipments (0–500 miles) are typically delivered within 1–3 days, assuming direct routing and standard carrier availability.
- Mid-distance shipments (500–1,000 miles) usually take 3–5 days, accounting for multi-state travel and scheduled stops.
- Long-distance shipments (1,000–2,500+ miles) commonly require 6–9 days of transit time under normal driving conditions.
- Cross-country shipments exceeding 2,500 miles often fall within a 7–10 day delivery window once the vehicle is picked up.
- Most auto carriers average 400–500 miles per day, depending on traffic, weather, and Hours-of-Service regulations.
- High-volume interstate corridors experience more consistent transit times due to predictable carrier flow and fewer reroutes.
Important Timing Clarification (Dataset Context)
- Transit time reflects on-truck travel time only.
- Pickup scheduling can add 1–5 additional days, especially during peak summer demand.
- Seasonal weather events may temporarily extend delivery windows on northern or mountainous routes.
Open vs Enclosed Car Shipping Usage & Cost Differences (U.S.)
Interstate car shipping in the U.S. is dominated by open-carrier transport, with enclosed shipping representing a smaller, specialized segment of the market. Industry data from 2023–2025 shows a clear imbalance in carrier availability, shipment volume, and pricing between these two transport methods. The statistics below reflect standard state-to-state vehicle shipments.
Key Statistics: Open vs Enclosed Interstate Car Shipping
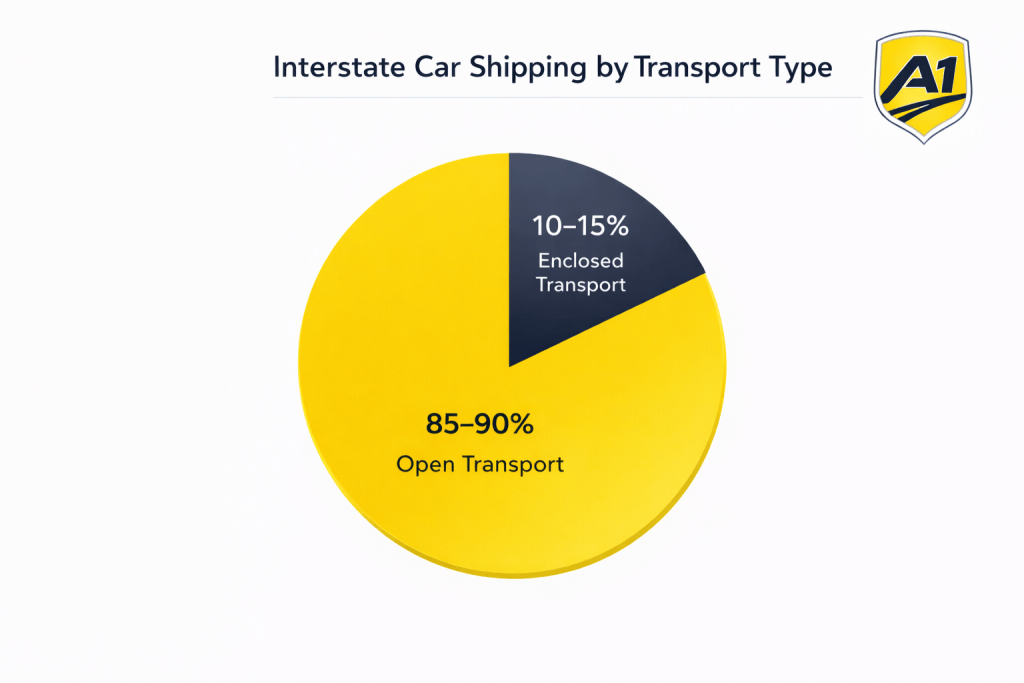
- Open-carrier transport accounts for approximately 85–90% of all interstate vehicle shipments in the U.S., making it the dominant transport method.
- Enclosed carriers handle roughly 10–15% of total state-to-state shipments, primarily for high-value, specialty, or collector vehicles.
- Enclosed shipping typically costs 40–60% more than open transport for the same distance due to lower load capacity and limited carrier supply.
- Open carriers commonly transport 7–10 vehicles per load, while enclosed trailers usually carry 1–4 vehicles, reducing cost efficiency.
- Carrier availability is significantly higher for open transport, resulting in faster pickup times on most interstate routes.
- Cost differences between open and enclosed shipping widen on long-distance routes where open carriers benefit from higher route density.
Market Structure Context (Dataset Explanation)
- Open transport dominates due to higher capacity and lower operating costs.
- Enclosed shipping remains capacity-constrained and priced at a premium.
- Most interstate routes are optimized for open carriers, reinforcing their market share.
- Enclosed transport functions as a niche service rather than a volume solution.
Seasonal Trends in State-to-State Car Shipping (U.S.)
State-to-state car shipping demand in the U.S. follows predictable seasonal patterns tied to household moves, weather conditions, and regional migration trends. Aggregated shipment data from 2023–2025 shows consistent fluctuations in pricing and carrier availability throughout the year. These trends affect both shipping cost ranges and delivery timelines across major interstate routes.
Key Statistics: Seasonal Car Shipping Trends
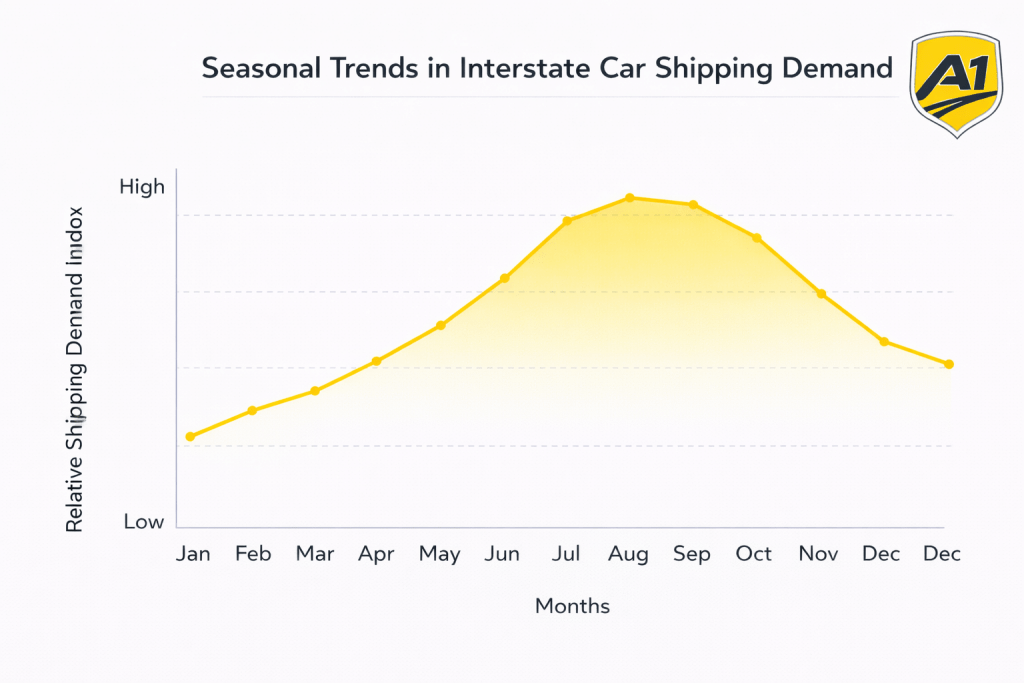
- Peak shipping season runs from May through September, accounting for roughly 30–35% of annual interstate vehicle shipments, aligned with national moving trends.
- Average car shipping prices during peak summer months are 20–30% higher compared to winter shipping periods due to increased demand and limited carrier availability.
- June, July, and August consistently show the highest booking volume, particularly on long-distance state-to-state routes.
- Winter months (December–February) typically offer the lowest average shipping costs, excluding holiday-related surges.
- Delivery timelines during peak season may extend by 1–3 additional days, especially on high-traffic interstate corridors.
- Seasonal migration patterns, including “snowbird” relocations, drive temporary demand spikes on north–south routes during late fall and early spring.
Seasonality Context (Dataset Explanation)
- Summer relocations increase competition for carrier capacity.
- Favorable weather enables higher shipment volume, but congestion slows scheduling.
- Winter demand softens, increasing carrier availability and price flexibility.
- Weather-related delays occur more frequently on northern and mountainous routes during winter months.
Interstate Migration Patterns Driving Car Shipping Demand (U.S.)
Interstate car shipping demand closely mirrors domestic migration patterns in the United States. Population shifts between states create predictable vehicle transport corridors, particularly between high-outbound and high-inbound states. Recent migration data from 2023–2025 highlights how these movements shape long-distance and regional car shipping volumes.
Key Statistics: Migration Trends Impacting Car Shipping
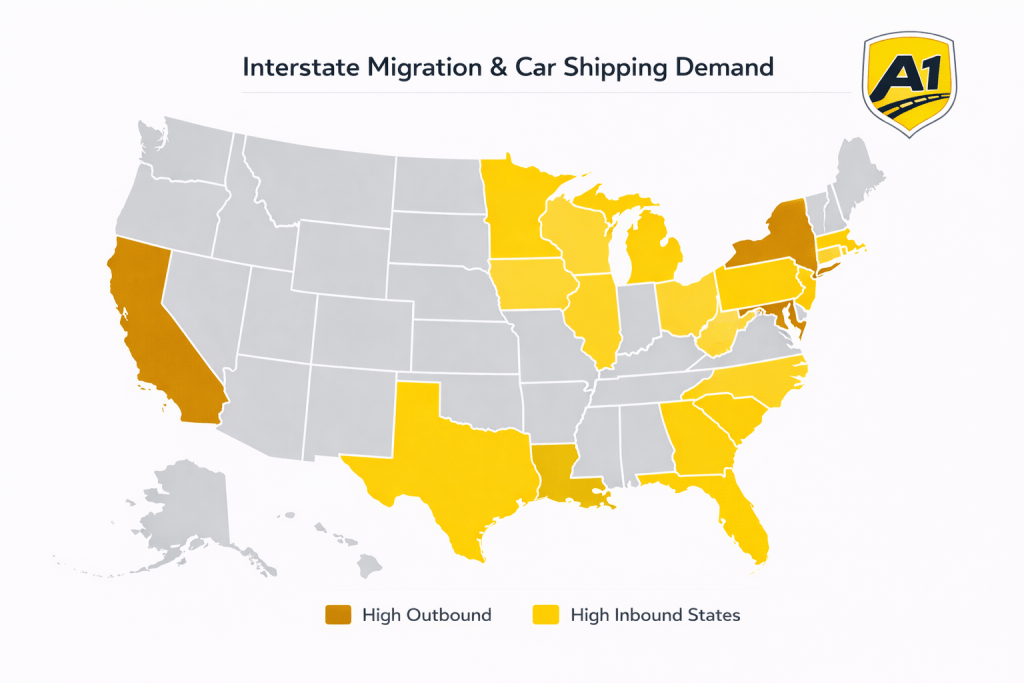
- Texas, Florida, and North Carolina rank among the top inbound states, driving consistent demand for state-to-state vehicle shipments.
- California, New York, and Illinois continue to record the highest net outbound migration, generating sustained outbound car shipping volume.
- California to Texas remains the single most active interstate migration corridor, supporting high-frequency car shipping routes.
- New York to Florida represents one of the most consistent long-distance vehicle transport lanes due to retirement and relocation trends.
- Southern and Sun Belt states account for a disproportionate share of inbound vehicle shipments compared to Midwest and Northeast states.
- Multi-year migration trends create stable, repeat shipping corridors rather than one-time demand spikes.
Migration-to-Transport Context (Dataset Explanation)
- Household relocations often involve at least one vehicle shipment.
- Long-distance relocations increase reliance on professional auto transport services.
- Migration corridors align closely with carrier route density and pricing stability.
- States with persistent inbound migration maintain higher year-round shipping demand.
Most Common State-to-State Car Shipping Routes (U.S.)
State-to-state car shipping demand is concentrated along a limited number of high-volume interstate corridors. These routes are shaped by long-term migration trends, employment relocation, and regional population shifts. Aggregated shipment and migration data from 2023–2025 shows consistent vehicle transport activity along the routes listed below.
Key Statistics: High-Demand Interstate Car Shipping Routes
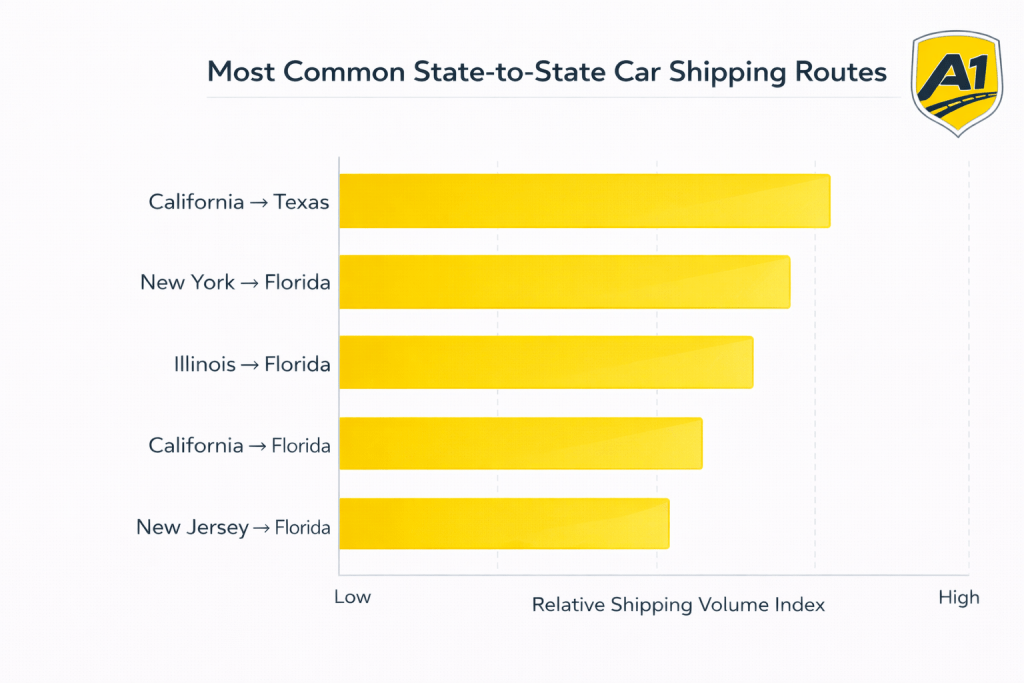
- California → Texas is the most active state-to-state corridor, driven by sustained outbound migration and long-distance relocations.
- New York → Florida remains one of the highest-volume long-haul routes, particularly among retirees and remote workers.
- Illinois → Florida consistently generates strong vehicle shipping demand during winter relocation cycles.
- California → Florida represents a major coast-to-coast transport lane with steady year-round activity.
- New Jersey → Florida continues to rank among the top routes due to seasonal and retirement-driven moves.
- Northeast → Southeast routes (e.g., New York, New Jersey, Massachusetts to Florida and the Carolinas) account for a disproportionate share of long-distance shipments.
- Midwest → Sun Belt routes (Illinois, Ohio, Michigan to Texas, Arizona, and Florida) remain structurally strong across multiple years.
Route Demand Context (Dataset Explanation)
- High-demand routes benefit from consistent carrier availability.
- Established corridors tend to have more stable pricing and predictable delivery timelines.
- These routes attract both consumer relocations and multi-vehicle commercial shipments.
- Long-term migration patterns reinforce route stability year over year.
Auto Transport Industry Benchmarks & Trends (U.S., 2023–2025)
The U.S. auto transport industry has experienced measurable shifts in pricing behavior, vehicle mix, and carrier capacity over the past several years. Aggregated industry data from 2023–2025 highlights how operational costs, shipment composition, and demand concentration continue to shape interstate car shipping trends. The benchmarks below reflect nationwide interstate activity rather than individual carrier performance.
Key Statistics: Industry Benchmarks & Trends
- The U.S. auto transport market is estimated to exceed $11 billion annually, supported by consumer relocations, online vehicle sales, and dealer-to-dealer transfers.
- Average interstate car shipping rates increased by approximately 15–25% between 2023 and 2024, driven primarily by fuel costs, labor constraints, and seasonal demand surges.
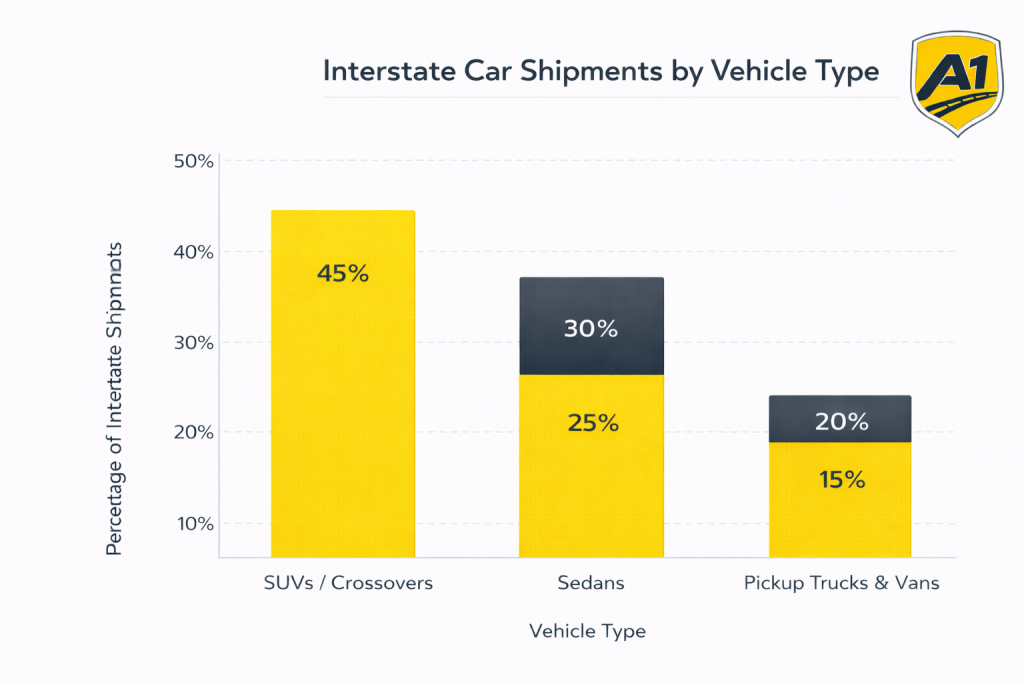
- SUVs and crossovers account for roughly 45–50% of all vehicles shipped interstate, surpassing sedans as the most frequently transported vehicle type.
- Sedans represent approximately 25–30% of shipped vehicles, while pickup trucks and vans account for 15–20%.
- Multi-vehicle commercial shipments improve cost efficiency, reducing per-vehicle transport costs by 20–30% compared to single-car moves.
- Carrier capacity remains highly fragmented, with a large share of interstate shipments handled by small fleets and independent owner-operators.
Industry Context (Dataset Explanation)
- Rising operating costs have influenced baseline pricing across all distance ranges.
- Vehicle size and weight increasingly affect shipment pricing and capacity planning.
- High-demand interstate corridors absorb a disproportionate share of available carrier capacity.
- Market fragmentation contributes to pricing variability between routes and seasons.
Key Takeaways
- Interstate car shipping costs in the U.S. are primarily driven by distance, with long-distance routes offering lower cost-per-mile efficiency.
- Average state-to-state car shipping prices generally range from $600 to $1,600 for open-carrier transport, depending on mileage and route density.
- Delivery timelines follow predictable distance-based patterns, with most interstate shipments completed within 1–10 days after pickup.
- Open-carrier transport dominates the market, accounting for roughly 85–90% of all interstate vehicle shipments.
- Seasonal demand peaks between May and September, contributing to higher prices and longer delivery windows during summer months.
- Interstate migration patterns directly influence car shipping demand, concentrating shipments along a limited number of high-volume corridors.
- SUVs and crossovers now represent the largest share of vehicles shipped interstate, reflecting broader shifts in the U.S. vehicle fleet.

 Share on Facebook
 Share on LinkedIn
 Share on Twitter
 Google
  Instagram