RV & Trailer Transport Statistics: Costs, Delivery & Trends

RV & Trailer Transport Cost Ranges by Distance (U.S.)
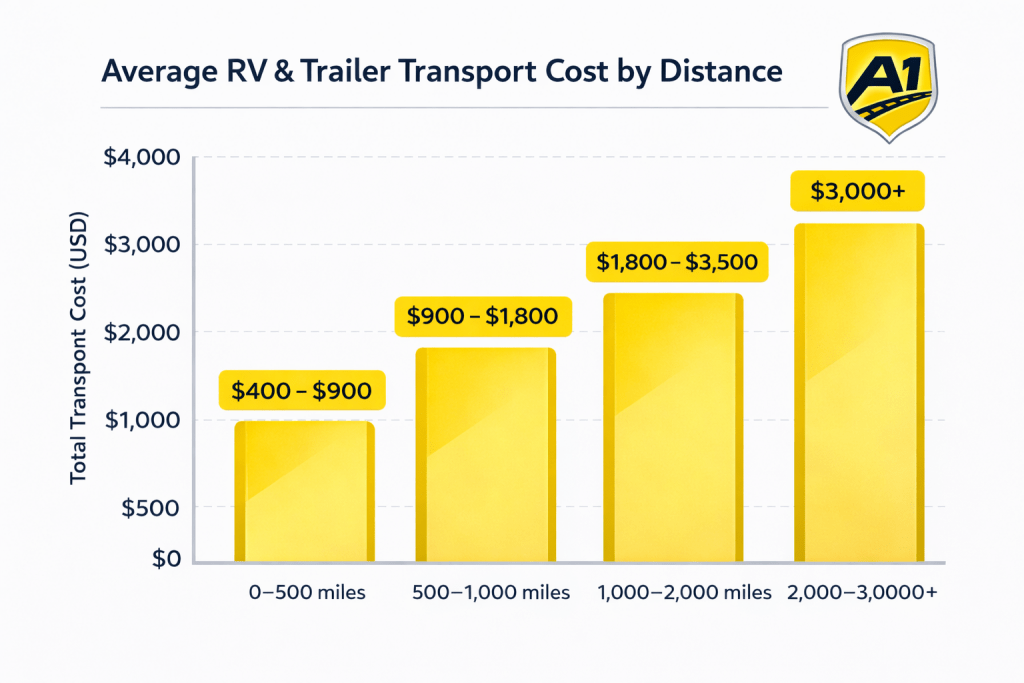
RV and trailer transport costs in the United States vary primarily by distance, vehicle size, and handling complexity. Compared to standard passenger vehicles, RVs and trailers introduce additional logistical considerations that influence base pricing across state-to-state routes. The cost ranges below reflect aggregated U.S. transport benchmarks.
Key Statistics: RV & Trailer Transport Costs by Distance
- Short-distance transport (under 500 miles) typically ranges from $400 to $900, reflecting higher per-mile costs on shorter routes.
- Mid-distance transport (500–1,000 miles) commonly falls between $900 and $1,800, offering improved cost efficiency as mileage increases.
- Long-distance transport (1,000–2,000 miles) generally ranges from $1,800 to $3,500, depending on RV size, weight, and route density.
- Cross-country RV and trailer transport (2,000–3,000+ miles) frequently exceeds $3,000, with larger motorhomes and fifth-wheel trailers reaching the upper end of pricing.
- Transporting larger or heavier RVsconsistently results in higher total costs compared to smaller travel trailers due to increased fuel usage and specialized equipment requirements.
- Total transport costs rise with distance, while average cost per mile declines on longer routes.
RV & Trailer Transport Cost per Mile by Size & Weight (U.S.)
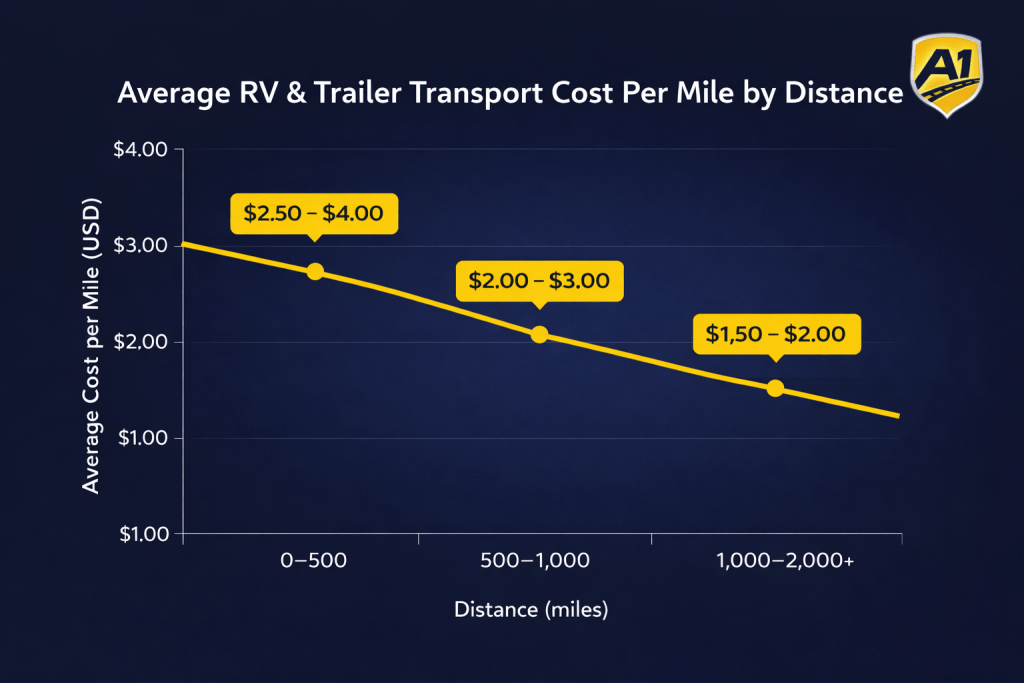
The cost to transport RVs and trailers on a per-mile basis varies significantly based on distance, vehicle size, and weight class. Larger and heavier RVs typically incur higher per-mile rates on shorter routes, while long-distance transport benefits from improved cost efficiency. The figures below reflect common U.S. transport benchmarks.
Key Statistics: RV & Trailer Transport Cost per Mile
- Short-distance transport (0–500 miles) typically averages between $2.50 and $4.00 per mile, reflecting higher fixed costs spread across fewer miles.
- Mid-distance transport (500–1,000 miles) commonly ranges from $2.00 to $3.00 per mile, offering a balance between distance and operational efficiency.
- Long-distance transport (1,000–2,000 miles) often falls between $1.50 and $2.00 per mile, as fixed costs are distributed over longer routes.
- Cross-country RV and trailer transport (2,000+ miles) frequently approaches $1.25 to $1.75 per mile, depending on route density and vehicle size.
- Larger motorhomes and fifth-wheel trailers consistently command higher per-mile rates than smaller travel trailers due to increased weight, height, and aerodynamic drag.
- Smaller towable trailers and camper vans tend to fall at the lower end of per-mile pricing ranges, particularly on long-haul routes.
RV & Trailer Transport Delivery Timelines by Distance (U.S.)
RV and trailer transport delivery timelines vary primarily by distance, route density, and scheduling availability. Due to vehicle size and handling requirements, RV shipments often take longer than standard car transport, particularly on long-haul routes. The timelines below reflect typical U.S. transit ranges once a vehicle is picked up.
Key Statistics: RV & Trailer Delivery Time by Distance
- Short-distance transport (under 500 miles) is typically completed within 2–5 days, depending on carrier routing and scheduling.
- Mid-distance transport (500–1,000 miles) commonly requires 4–7 days of transit time.
- Long-distance transport (1,000–2,000 miles) generally takes 7–10 days, accounting for multi-day driving limits and routing stops.
- Cross-country RV and trailer transport (2,000–3,000+ miles) often falls within a 9–14 day delivery window.
- Larger RVs and fifth-wheel trailers may experience slightly longer timelines due to permitting, escort requirements, or specialized equipment.
- Seasonal demand and weather conditions can temporarily extend delivery timelines, particularly during peak summer and winter migration periods.

RV & Trailer Transport Methods Breakdown (U.S.)
RVs and trailers are transported using several specialized methods depending on size, weight, and drivability. Unlike standard vehicles, many RVs and trailers require non-driving transport solutions to ensure safety and regulatory compliance. The breakdown below reflects common U.S. transport method usage.
Key Statistics: RV & Trailer Transport Methods
- Tow-away transport accounts for approximately 40–50% of RV and trailer shipments, primarily for travel trailers, fifth wheels, and smaller towable units.
- Flatbed and step-deck transport represents roughly 25–35% of shipments, commonly used for large trailers, non-roadworthy units, or oversized RVs.
- Drive-away transport makes up about 15–25% of shipments and is typically limited to drivable motorhomes that meet road safety standards.
- Oversize or permit-required transport applies to a smaller share of shipments, often involving large Class A motorhomes exceeding standard height or width thresholds.
- Towable trailers are significantly more likely to be moved via tow-away or flatbed methods, while motorized RVs dominate the drive-away category.
- Transport method selection directly influences both cost structure and delivery timelines across interstate routes.

Seasonal Trends in RV & Trailer Transport (U.S.)
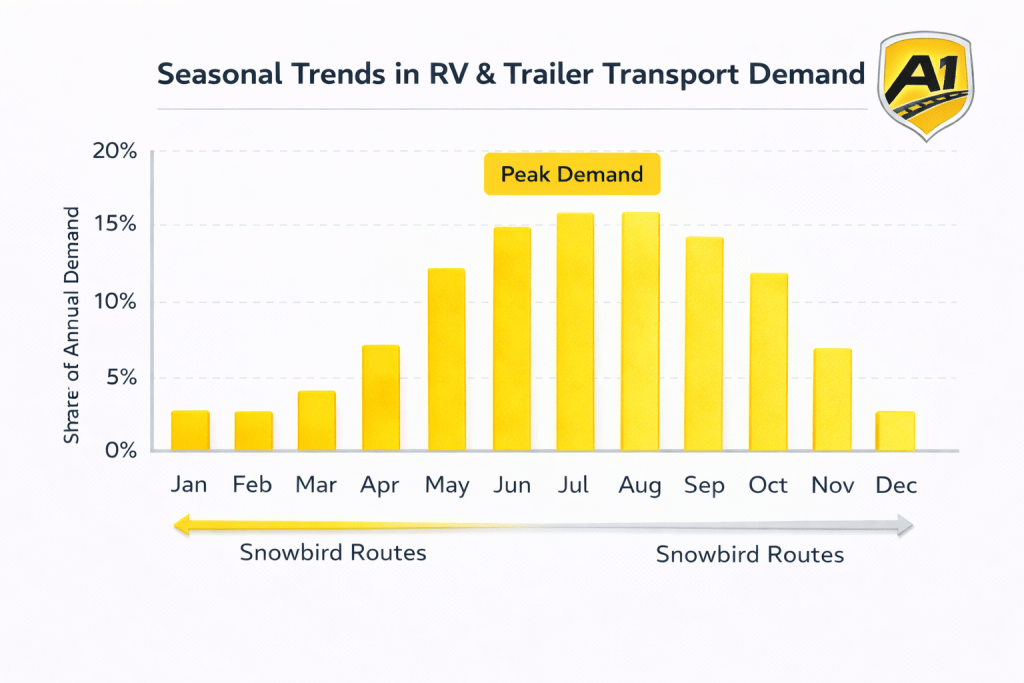
RV and trailer transport demand in the United States follows clear seasonal patterns driven by travel behavior, weather conditions, and regional migration. Transport volume and pricing tend to fluctuate throughout the year as demand concentrates around specific months. The statistics below reflect typical seasonal transport trends.
Key Statistics: Seasonal RV & Trailer Transport Trends
- Peak transport demand occurs between April and August, accounting for the highest share of annual RV and trailer shipments.
- Late spring and early summer experience the strongest volume increases as RV travel and camping season begins nationwide.
- Fall transport demand (September–October) remains elevated due to return travel and relocation following peak summer usage.
- Winter months (December–February) typically show reduced overall transport volume, except for snowbird migration routes.
- Southern destination states see increased inbound RV transport during winter months as seasonal residents relocate.
- Transport pricing and delivery timelines are most impacted during peak summer months, when carrier availability tightens.
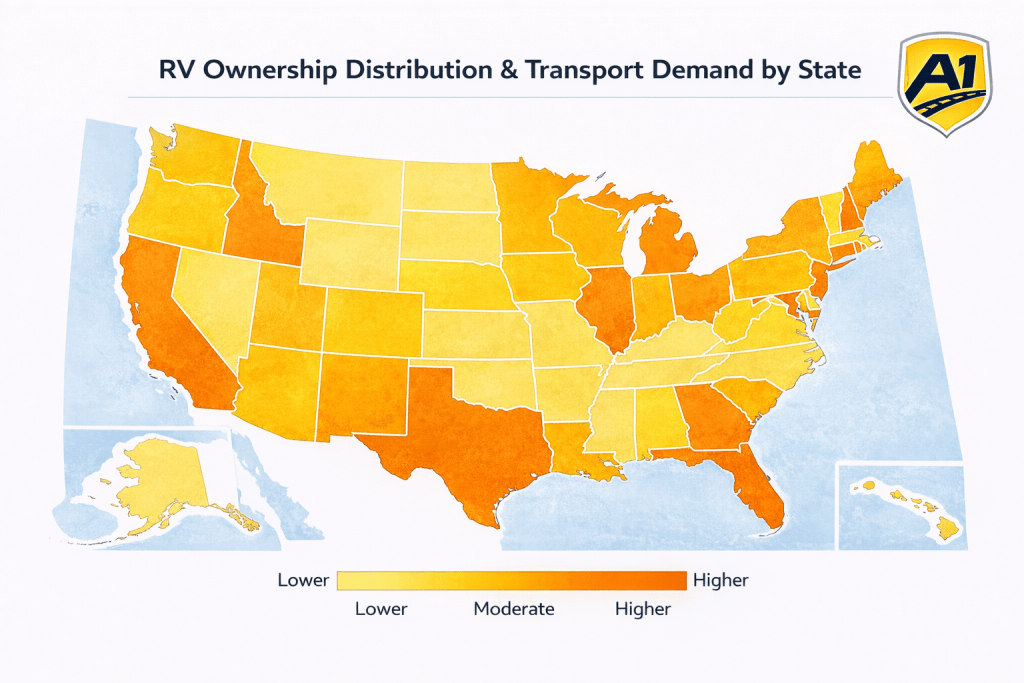
RV Ownership Distribution & Transport Demand by State (U.S.)
RV ownership levels vary widely across U.S. states, directly influencing interstate RV and trailer transport demand. States with higher RV ownership rates and seasonal usage patterns generate a disproportionate share of outbound and inbound transport volume. The statistics below reflect state-level RV ownership and its relationship to transport demand.
Key Statistics: RV Ownership & Transport Demand by State
- Florida, Texas, and California consistently rank among the states with the highest total RV ownership, driving significant inbound and outbound transport activity.
- Indiana, Michigan, and Ohio show elevated outbound RV transport demand due to manufacturing concentration and dealer distribution.
- Arizona and Florida experience strong seasonal inbound RV transport during winter months linked to snowbird migration.
- Western states with large land areas and outdoor travel demand exhibit higher per-capita RV ownership, increasing regional transport volume.
- States with high RV park density tend to generate more frequent short- and mid-distance RV transport movements.
- RV ownership distribution aligns closely with seasonal transport corridors, reinforcing predictable interstate shipping patterns.
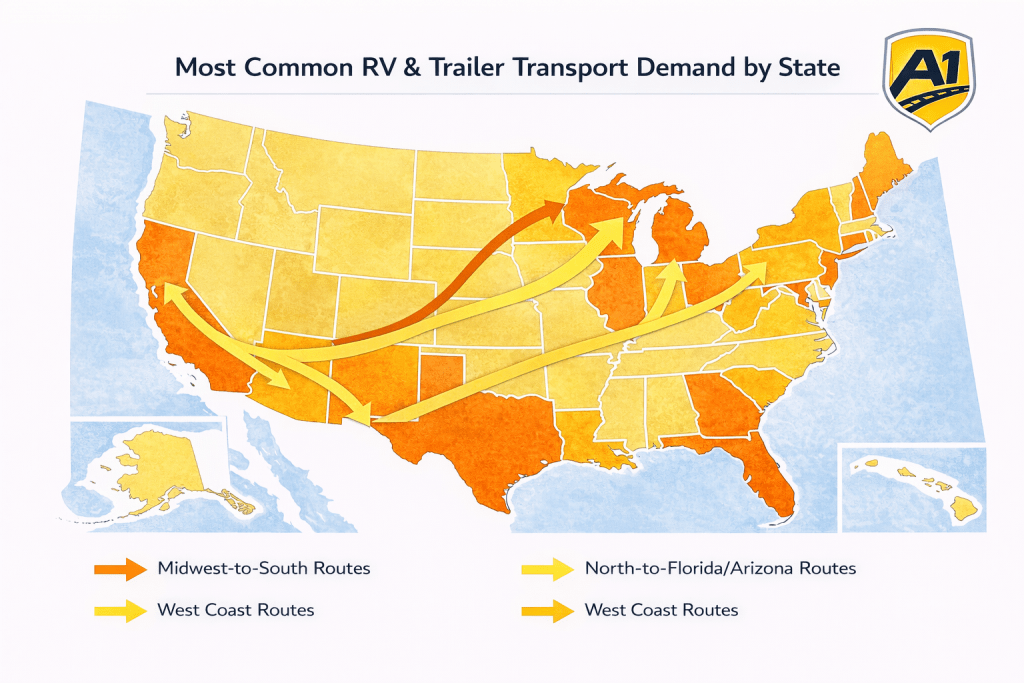
Most Common RV & Trailer Transport Routes (U.S.)
Interstate RV and trailer transport routes in the United States follow consistent geographic and seasonal patterns. These routes are shaped by RV manufacturing locations, population centers, and seasonal migration trends. The data below highlights the most frequently used transport corridors.
Key Statistics: Common RV & Trailer Transport Routes
- Midwest-to-South routes represent one of the highest-volume RV transport corridors, driven by manufacturing distribution and seasonal relocation.
- Indiana-to-Texas, Indiana-to-Florida, and Indiana-to-California are among the most common long-distance RV transport routes.
- Northern states to Florida and Arizona account for a significant share of seasonal RV transport during fall and winter months.
- West Coast routes, particularly inbound shipments to California and Arizona, maintain steady year-round transport volume.
- Short- and mid-distance regional routes remain common in states with high RV ownership and dealership density.
- RV transport routes closely mirror broader population movement and recreational travel patterns across the U.S.
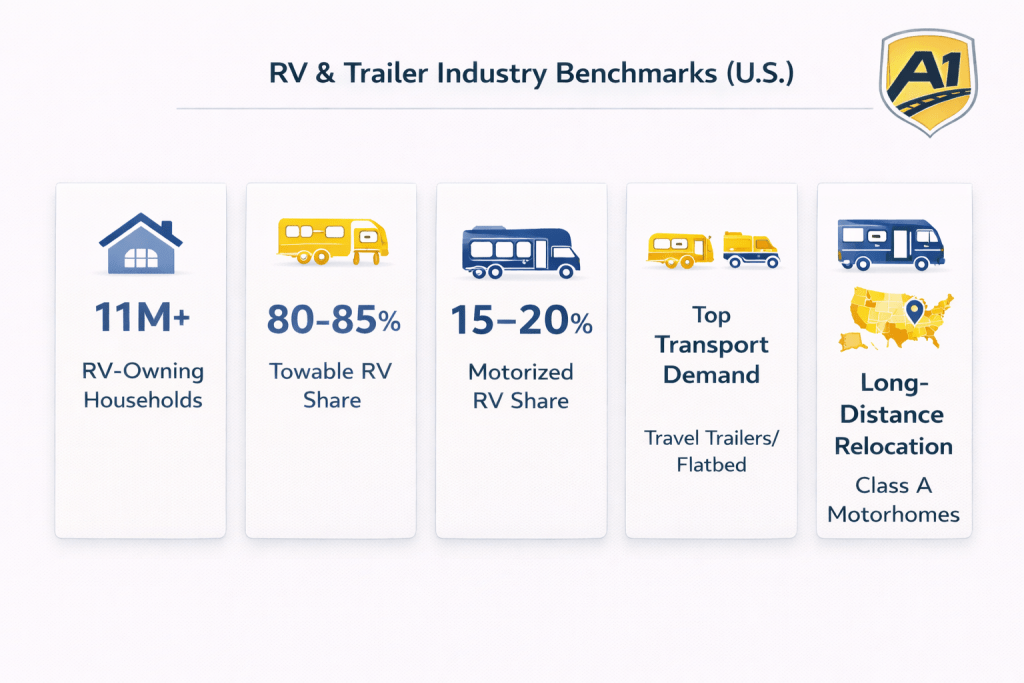
RV & Trailer Industry Benchmarks (U.S.)
The U.S. RV and trailer transport market is supported by a large and geographically diverse ownership base. Industry benchmarks related to RV ownership, vehicle types, and usage patterns help explain long-term transport demand across interstate routes. The statistics below summarize key structural benchmarks.
Key Statistics: RV & Trailer Industry Benchmarks
- The United States has over 11 million RV-owning households, making it one of the largest RV markets globally.
- Towable RVs (travel trailers and fifth wheels) account for approximately 80–85% of all RV units on U.S. roads.
- Motorized RVs (Class A, B, and C) represent roughly 15–20% of the total RV population.
- Travel trailers are the most common RV type, driving the majority of tow-away and flatbed transport demand.
- Class A motorhomes account for a smaller share of units but represent a disproportionate share of long-distance transport due to size and relocation patterns.
- RV usage is heavily concentrated in seasonal travel and long-distance relocation, reinforcing steady interstate transport demand.
Key RV & Trailer Transport Dataset Takeaways (U.S.)
- RV and trailer transport costs increase with distance, while average cost per mile declines on longer interstate routes.
- Vehicle size, weight, and height are primary cost drivers, with larger motorhomes and fifth-wheel trailers consistently commanding higher transport rates.
- Delivery timelines scale predictably with mileage, with cross-country RV transport commonly requiring 9–14 days once in transit.
- Tow-away and flatbed transport methods account for the majority of RV and trailer shipments, while drive-away transport is limited to roadworthy motorhomes.
- Seasonal demand significantly influences transport volume, particularly during summer travel months and winter snowbird migration periods.
- RV ownership distribution across states directly shapes interstate transport corridors and demand patterns.
- The dominance of towable RVs (80–85%) reinforces steady long-haul and regional trailer transport activity across the U.S.

 Share on Facebook
 Share on LinkedIn
 Share on Twitter
 Google
  Instagram