Gift Icon
Get a 20% discount from our partners! Discount code will get added automatically when you submit the form.
Auto Transport Truck on Highway
4.7 Star Rating4.7 (67,926 reviews)
96.3% positive
No Surprises, Just Savings: Verified Carriers, Instant Quotes, and Best Price Guarantee!
You save 20% compared to other companies
Get quotes from trusted carriers, thoroughly vetted and fully insured. Enjoy trackable deliveries, fair pricing, and hassle-free transport from start to finish. Transport any type of vehicle and drive away worry-free.
Customer Images
7790 people shipped using A-1 Auto Transport last week
Scratch-Free Guarantee
Vetted Carriers
Transparent Costs
Customer Ratings By Feature
Value for Money ★★★★★ 4.9
Vehicle Care ★★★★★ 4.9
Fast Delivery ★★★★★ 4.9
Friendly Staff ★★★★★ 4.9
Globe
190+
Countries
Served
Car
2M+
Delivered
Services
Car
97%
Customer
Recommended
Dave loved the fast deliveryDave C.
★★★★★
Dave loved the fast delivery
My relocation to Chicago was fast, smooth and without any delay thanks to A1 Auto.
Courtney enjoyed the honest guidanceCourtney J.
★★★★★
Courtney enjoyed the honest guidance
Just what you need when trusting someone with your wheels! Kudos to this company!
Jeff enjoyed the fair priceJeff D.
★★★★★
Jeff enjoyed the fair price
Moved my ride hassle-free with these folks.Fair pricing, no surprises. Definitely recommend them!
Maria enjoyed the special care and safetyMaria L.
★★★★★
Maria enjoyed the special care and safety
Huge thanks to the movers – they were meticulous with my car. Love these guys.
Recently featured on USA Today

“A1 Auto Transport became synonymous with top-notch service delivery, unfailing punctuality and constantly preoccupied with customer satisfaction.

See Article— USA Today

2018-2019 USA Transportation Statistics

Published by Joe Webster.

What's in this article?
  1. Foundations for the policy making act based on evidence
  2. Geospatial Data Act
  3. Transformation in transportation Measurement modifications
  4. Challenges and strengths in transport statistics
  5. System capacity, use, and extent
  6. System performance and condition
  7. Moving people
  8. Moving goods
  9. Transport economics
  10. Safety
  11. Energy and the environment
  12. New data types to measure transport
Transportation Rate And Statistics Report Of USA

The Geospatial Data Act and the foundations for a policy making Act based on evidence are among the newest laws regarding the transport industry of the United States. 

The relevance of BTS programs is underlined by federal statutes created in the years 2018-2019, which relate emerging issues of statistical information to their importance in making nation-wide decisions.

Foundations for the policy making act based on evidence

The act emphasizes the original duties of BTS in sustaining decisions with timely, accurate, and objective information. Enforcing most of the proposals of the commission on policymaking based on evidence, the act emphasizes the duties of agencies that operate federal statistics, defines in law an older executive order related to open government information, and translates in code the Confidential information protection and statistical efficiency act, as well as the Statistical policy directive No. 1.

There are a couple of key functions that are mandatory for all departments according to the Evidence act: one chief data officer, one evaluation officer, and one statistical official that has to give advice on statistical procedures, techniques and policy. The role of the statistical official is held by the Director of BTS, the main counselor to the Secretary on statistics and data, and the role of a chief data officer is portrayed in the department of the chief information officer. The newly formed position in the Department of Transportation is that of an Evaluation Officer, charged with the assessment of the quality, coverage, consistency, methods, evaluations’ balance, independence, effectiveness, active evaluation activities, and policy research of the DOT. A part of the responsibilities of these 3 officials intersect, and the focus on evaluation protocols goes beyond the Department of Transportation’s traditional emphasis of accomplishment quantification on main indicators, program output policies, and policies of actionable factors. Since policies of actionable factors may improve regardless of the actions taken, true results have to be quantified through tests that determine if the performed actions induced the modification of the factors. According to the Evidence Act, the data that the Evaluation Officer uses to create true measures of results and technical expertise are provided by the Statistical Officer.

Results from the evaluation and various other research activities are useful only if the supporting data, methods, and findings are available for use and review. The 2nd title from the Evidence Act ensures that government data is open to everyone, unless restrictions of security and confidentiality are placed on it. Title 2 emphasizes this accessibility with a procedure developed in BTS in 1997 for the National Transportation Library (NTL), in order to: 

  • Manage, preserve, and acquire transport information to be used by federal agencies, the general public, and the Department of Transportation;
  • Provide research assistance and reference;
  • Function as a main depository for the results of DOT technical publications and research;
  • Provide the Federal Government with a central clearing house to transport information and data;
  • Serve as policy lead and coordinator for information access on transportation.

In accordance with the Dot's Plan to Increase Public Access to the Results of Federally Funded Scientific Research Results, the NTL guides the DOT to implement open government data. 

2018 Geospatial Data Act

The Bureau of Transportation Statistics is an active federal system in the geospatial information division. In 1994, the first TSAR (Transportation Statistics Annual Report) allocated a section to the GIS (geographic information system). In the past 25 years, the technology of GIS has evolved. However, there are some promised developments in geo-data that remain unachieved. For instance, multiple presentations of the highway system in the country are maintained by private sectors and the Federal Government. However, these presentations never matched the physical features’ locations which are noticeable on the ground and measurable from above.

The 2018 Geospatial Data Act tries to lessen the inconsistencies and inefficiencies of public geo-data through oversight and coordination. This act was signed into law under Federal Executive Orders.

National Spatial Data Infrastructure is described as the technology, criteria, policies, standards, and human resources necessary for sharing geospatial data across the Federal Government, local governments, tribal, state, and private sectors (including higher education institutions and nonprofit organizations). Building and disseminating the NSDI’s (National Spatial Data Infrastructure) transportation layer, coordinating the progress of geospatial data standards on transportation, organizing intermodal transportation geospatial data, as well as the collection of geospatial data that has not been gathered by other institutions, is assigned to the Bureau of Transportation Statistics under the codified Act. Moreover, the NTAD (National Transportation Atlas Database), published by the Bureau of Transportation Statistics, provides an accurate, updated, and consistent representation of the transportation system.

Measurement Of Modification Are Faster For The Rapid Growth Of Technology

Transformation in transportation: Measurement modifications

There is a significant evolution in the world that the Bureau of Transportation Statistics was made to measure. The measurement and nature of transportation are changing through technology in extraordinary ways, whereas computers were initially used in forecasting urban travel demand 60 years ago. Several technologies are improved variants of conventional types of transportation, like ride-hailing apps instead of conventional taxicab services. Others are completely new, such as aerial drone deliveries.

To support progressive decisions, the safety, operational, societal, and economic aspects of autonomous transportation and new technologies providing services in this field should be reviewed by the Bureau of Transportation Statistics. Moreover, these technologies are emerging to new mobility business models, and producing new data sources that provide necessary transportation statistics.

Transportation technology is changing in several ways, such as the widespread adoption and autonomous operation of electrified vehicles. Automated vehicles are well-equipped with a range of driver-assistance systems that aim to improve safety and encourage the adoption/usage of self-driving automobiles. A cargo of oysters was delivered across the Atlantic Ocean by an autonomous vessel, while the development of driverless air taxis is underway. Major automobile manufacturers are still developing alternative fuel vehicles. Electric aircraft prototypes are developed and designed for short-haul and low-flying passenger movement, while delivering local goods using surface drones and aerial vehicles is being tested. Furthermore, electric scooters are now common in several cities.

New questions about statistics development and traditional statistics reinterpretation were raised due to these transformations in transportation services and technology. Some of them were brought up due to the critical issues listed in 2019 by the Transportation Research Board:

  • To what extent will electric scooters, ride-sharing services, shared and personal bicycles reduce single-occupant vehicle commuters?
  • Will automated vehicles or shared services with a lower operating cost remarkably improve transportation for families that aren’t using a personal car?
  • How should the impacts of automated vehicles on parking search be evaluated?
  • With the use of automated vehicles, will there be any impact on the volume of vehicles and their usage, affecting the revenues offered for road construction, and vehicle registration maintenance?
  • How will automated vehicles affect the types and number of automotive jobs for drivers, technicians, and mechanics?
  • Will advanced driver-assistance systems change the monitoring system for safety issues based on category?
  • Will automated vehicles lessen the value of travel time by letting the passenger do things aside from driving?
  • How will the pervasive transport electrification system affect fuel taxes?
  • How is the environmental impact of mining, consuming, disposing, and producing of transport fuels and automotive battery systems going to be evaluated?
  • How should alternative-fuel refueling stations and adequate charging infrastructure coverage be determined?
Technological Changes In Transportation Raise More Questions

Technological changes in transportation raise more questions that need the consideration of transportation statistics: 

  • How does part-time employment growth, widespread wireless communication availability, ease of information access on the internet about anything, such as consumer products to tourist attractions, additive manufacturing or 3D printing, and other digital economy aspects affect logistics and travel demand?
  • How will the workforce be affected by the pervasive adoption of automated freight transportation?
  • What are the effects of enabling work from home and allowing goods to be delivered via overnight shipping on how geographic accessibility and mobility should be measured and defined?

There are more questions raised due to Culture change and other factors apart from technology that support statistical insights:

  • What are the effects of the ageing population to safe transportation and passenger travel patterns?
  • What will be the impact of modifications in the household structure of income on passenger travel patterns?
  • What could be the impact of changes in income and the ageing population on patterns of consumption that affect the freight movement demand?
  • What will be the impact of increased public health awareness on walking and bicycle travel?
  • What are the impacts of increased attention to recycling in transportation based on what materials are used and transported?
  • What are the effects of natural disasters on the transportation of goods, the performance of transportation systems, and on travel demand?

Challenges and strengths in transport statistics

The United States’ transportation system connects an economy and a society throughout the North part of the American continent while binding together the American Nation and the world. In order to understand how transportation connections work and how to improve the system, the public and decision-makers ask several questions regarding the System:

  • What’s the capacity and the extent of the network, and what percentage of the capacity is in use?
  • Is the network in good condition?
  • What is the performance of the system from the point of view of system users and device operators?
  • How well do goods and people get moved through the system?
  • How hard does the network try to promote the economic growth and the economy as a whole?
  • How safe is the economy with transport activity?
  • How stable is the transport network?
  • What are all the effects of transport on the environment and energy?

Although statistics are accessible to answer concerns, flaws in data discourage educated judgments that impact the livelihoods and lives of citizens.

The Capacity And Extent Of The Transport System Are Usually Defined By Modal Components

System capacity, use, and extent

The capacity and extent of the transport system are usually defined by modal components, such as roads, railways, waters, pipelines, and air transport systems.  Use is best described by the no. of crafts, vessels, and vehicles running on such networks.

Data is generally open to the general public at a state level for highways, waterways, transit networks, and aviation. Inland and air traffic services are managed by the Federal Government and funding is provided for transit systems and highways. Public statistics about ports, pipelines, and railroads are constrained, because they are either operated in private on leasehold community facilities or privately owned.

The DOT modal administrations preserve statistics on the use, capacity, and extent of transportation infrastructures:

  • Network statistics and forecasts of vehicle movement from the state transport departments are provided to the Federal Highway Administration (FHWA);
  • Infrastructure data is acquired from FRA instrumented ferries operating on the railway network by the Federal Railroad Authority (FRA);
  • The Federal Transit Administration (FTA) offers a comprehensive overview of information from public transport operators;
  • The FAA (Federal Aviation Administration) gathers extensive information on the use, capacity, and extent of airports and aviation networks that it includes or operates in the National Plan for Integrated Airport Service;
  • Information regarding the pipeline network is provided by Pipeline and Hazardous Materials Administration (PHMSA), though regional data is not usable for security purposes.

Apart from the DOT, the United States Army Corps of Engineers gather data on domestic waterways from the amenities operated by the Corps and commercial ship operators.

The BTS is compiling and publishing statistics on the characteristics and extent of the NTAD (National Transportation Atlas Database). The BTS is actively updating the National Transportation Atlas Database and introduces fresh layers of knowledge with the addition of newer geospatial details. 

The port performance statistics program of the BTS also produces consistent data on throughput and port capacity. The program is essential because most of the data published by each port cannot be comparable among ports.

FTA system-wide information is provided by public transit operators that receive Federal funding. However, these results could be boosted by adding segment-specific utilization data and facility. National statistics are scarce on services of transport provided for students by their school districts, for clients by agencies conducting social services, for groups of tourists by operators charter buses, or various ride services, although they can provide a significant share of mobility assets in plenty of other areas.

Community transportation network operators who’ve received federal grants provide systemwide data to the FTA. However, the addition of segment specific usage and facility information could improve this data. National data on the transport of students by school districts, of clients by social service agencies, of groups of tourists by charter bus operators, or other services of ride-hailing are not available, although they can provide a significant portion of transport resources in multiple regions.

While there is little national knowledge on bicycle transport, the BTS and its associates are currently investigating data sources on the exponential rise in electric bikes available to rent in several areas. Data on the usage of such services is essential to understand how effectively people are serviced, so it may impact improvements in the provision of public transport. Efficient understanding of the various services for the mobility of passengers is key to investment guiding in multiple ways and for programs that help the mobility disadvantaged. 

Technological progress is further challenging the comprehension of services for passenger mobility. One highlight is the implementation of the General Transit Feed Specification (GTFS) by several transit resources for publishing arrival information and schedules for clients. 

Data based on GTFS indicates the frequency and extent of service. More and more transit properties are supplying BTS with their GTFS data to be included on the National Transit Map. Intercity bus operators work together with the BTS to extend the usage of GTFS and to incorporate proposed intercity bus services in the National Transit Map.

Capacity Affects Both The People Who Utilize The System And Transport Service Providers

The NTAD offers details on intermodal interactions, including GTFS-based details representing similarities between local and intercity passenger services. Information on freight and passenger intermodal connections includes docks and ports, intercity railway and transit terminals, bike-share hubs, and airports. The publicly available data bases are poorly represented for motor rental facilities, pipeline terminals, and truck terminals.

Decisions to invest in transport at all government levels would stand to gain from a greater comprehensive view and a greater sense of the system’s capacity for currently offered services. While most individuals drive in their own cars, a substantial part of the public relies on transportation companies for their transport services. 

Some areas and demographic groups may seem underserved when the need for mobility is actually met by non-traditional transport services. Although the services offered to other regions and populations appear to be adequate, they don’t connect to the essential destinations or function at times of desired mobility. 

Many services and facilities can provide the required connection, but they lack the ability to satisfy current passenger and freight mobility demand rates. Capacity is the main component of network efficiency that is addressed in this segment. It affects both the people who utilize the system and transport service providers. Capacity is hard to evaluate since physical restrictions can be enhanced or exacerbated by the ways the system is controlled.

System performance and condition

The FTA and FHWA provide detailed information on performance and condition in biennial progress assessments on “Status of the Nation’s Highways, Bridges and Transit: Conditions and Performance”. Similar data regarding airports is provided by the FAA in the biennial NPIAS report (National Plan of Integrated Airport Systems).

Unit state tests are unique to the various types of transport. For instance, the state of the airport lane is determined by descriptive categories, and the condition of the highway pavement is portrayed by the roughness of the pavement which is determined by specific instruments mounted on vehicles.

The condition of bridges is dependent on measurable features, such as scour, spalling, and cracking, outlined in adequacy scores that have been characterized as functionally obsolete or structurally deficient and are now deemed fine, poor or average.
Age is sometimes utilized as a substitute for condition, particularly for aircraft and vehicle fleets, and inland waterway locks; however, time passing does not outline how repairs and rehabilitation investments could maintain good conditions.

Unit efficiency metrics are typically focused on reliability and travel speed. Congested conditions occur when real speeds slip below the speed limits; at that point, reliability is calculated by the discrepancy between estimated times of arrival and actual times of arrival when routes get uncongested.

Speed information is available for ships, commercial aircrafts, and vehicles, and the main railways publish the average speed for their systems. Timely output data for commuter rail, Amtrack and commercial aviation is published.

Most planned and current performance statistics are elaborated in the view of those that operate and build the transport system. From this perspective, carriers are more widely protected and globally aware than in the past in gathering data on resource protection and traffic plans.

The emphasis on network efficiency optimization includes real-time traffic information independent of configuration, ranging from road signal to the air transit control system of the country.

The perspective the system provides is important, even though it is incomplete unless complemented by user performance measures. For instance, a network of transportation that spreads delays evenly to all passengers may be accepted better than a program that focuses the same overall delay on just a percentage of the passengers. Delays also affect some travel purposes more than others. Delays can prove to be critical for emergencies of a medical nature, but just a slight irritant for sightseeing trips.

Regardless of the purpose of the trip, delays within commercial aviation become hindering when it prevents passengers from catching connecting flights. Delays in container transport cause more costly issues for carriers of high-valued or perishable products than it does for carriers of bulk goods.

Uncertainty is an expensive issue for all carriers and shippers of freight. Data on delay doesn’t usually identify which types of transport, corporations, or users are impacted or how often groups, freight, and individuals are tardy.

The Nation’s Transport Network Integrates Extensive Long Distance And Local Travel

Moving people

To meet the requirements of foreign visitors and United States residents, the Nation’s transport network integrates extensive long-distance and local travel. Local travel generally includes regular trips for recreation, shopping, school, work, as well as various services. Trips over long-distances are less common and can fulfill many functions. Modal usage varies as well between long-distance (aviation) and local travel (public transit).

National data on local and long-distance travel through specialized facilities or for individual modes are composed from sources, like the ridership data of Amtrack, the monthly issued data of BTS on airborne passenger enplanements, the National Transit Database of the FTA, and the BTS’s biennial National Census of Ferry Operators. 

Additionally, the BTS provides monthly information on the inbound crossings of the border gathered by Customs and Border Protection. These facility-specific and mode-specific sources don’t include information on charter travel and intercity buses by general aviation and by personal vehicles.

The National Household Travel Suvery (NHTS), sponsored by a number of states and metropolitan organizations, as well as by the FHWA, provides most national data on passenger travel by personal car. The NHTS gathers details on specific journeys, the demographic, as well as other individual details that determine a choice about where, if and how long the journey should be made. Even though the NHTS gathers data on all personal transport travel, it mainly identifies local journeys on a day-to-day basis.

The high costs of performing this form of national survey have reduced its frequency to once every 5-8 years. Despite various limitations, the NHTS is the only regional authority with detailed data to grasp travel resolutions and demand forecasts for transport. The FHWA considers approaches to gather data annually by posing less questions about less households and incorporating additional data sources within the NHTS.

The ACS (Census Bureau’s American Community Survey) is another frequently used data source on all modalities of transport for work commuting. The Census Bureau’s American Community Survey gathers this information from regular population surveys. In comparison to the once-a-decade-old statistics given by decade old censuses, this study offers details for local areas every year. In conjunction, the ACS provides commuting to work data over a range of years in specific regional divisions, whereas NHTS results are only relevant at the state and national levels, as well as for selected areas of metropolises.

In its program for the Local Area Transport Characteristics of Households, the BTS uses ACS and NHTS data for estimating the travel generation at the level of the Census Tract.

NHCS, ACS, and other departments’ statistics are essential to an overview on how demographic changes through geography and community types impact transport. Decreasing the economic activity of the population in most rural areas, driving behavior across generations, and other demographic and geographical changes could create multiple requests on the future transport system that can or cannot be effectively served through scheduled contributions by the private and public sectors.

While information is accessible on the trips’ number on intercity rail and commercial aircraft, nationally consistent data on long-distance transport in personal cars, charter buses, general aviation, and intercity buses is not gathered. For over two decades, the long-distance travelers' demographic characteristics, useful as an appraisal for future demands, have been unmeasured. As a result, current discussions of tendencies in commuters travel and the implications of trips are prevailed by local travel measures.

This limitation could lead to less informed regional investment decisions, because long distance travelling involves different travel conditions and purposes than local journeys. As many as dozens or hundreds of local voyages can be produced by one long distance journey. Further research on long-distance transport will be helpful in influencing judgments on travel, like how the cumulative health threat of long-distance and local journeys is impacted.

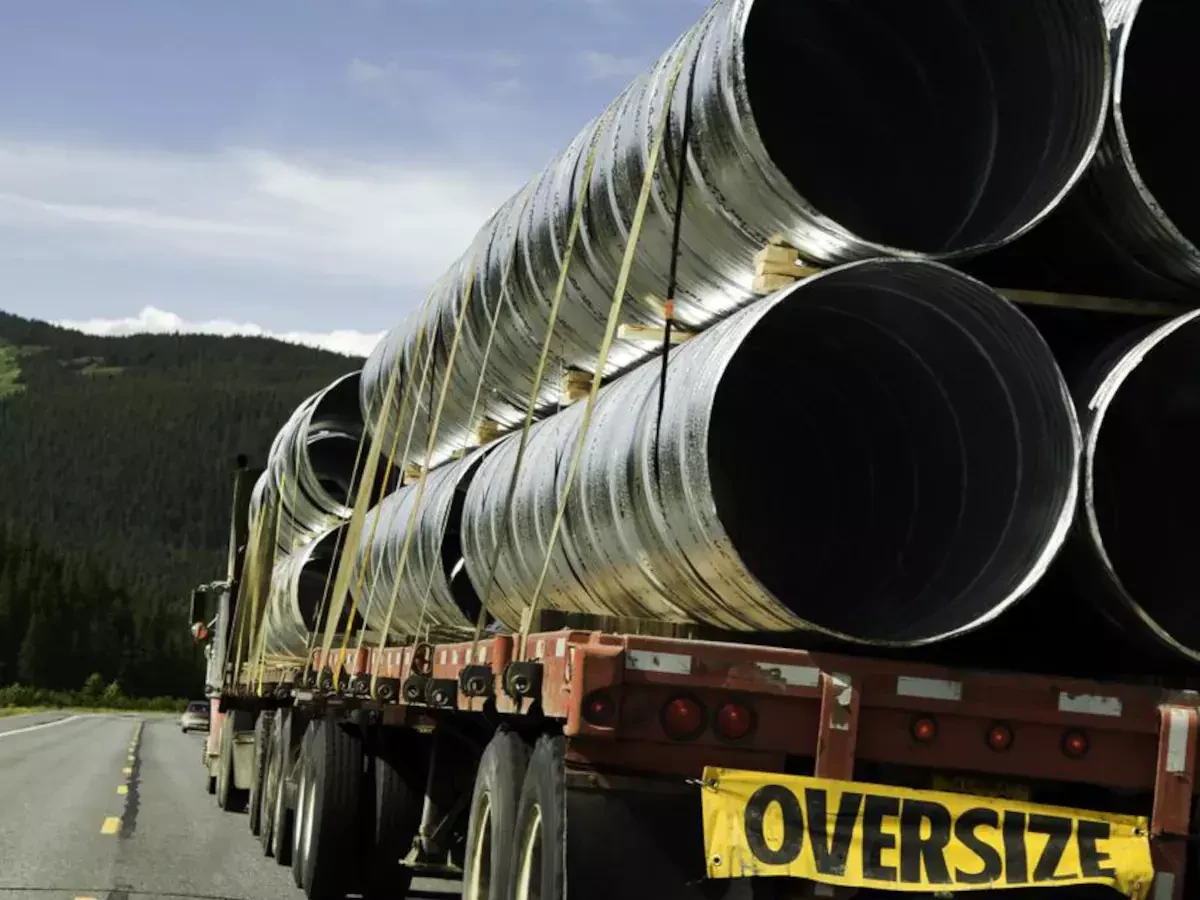
Moving Goods After Packing In The Cartons

Moving goods

Apart from transporting passengers, the transport system supports freight movement. Statistics on carriers and shippers that use the transport system focusing on the rulings made by these carriers and shippers, as well as on items moved are crucial to checking if issues regarding the efficiency of the transport network require public intervention.

Because of the complexity and magnitude of freight transport, no particular data collection offers a detailed description of the annual freight flow from supplier to customer by each form of transport and across all forms of product. The Commodity Flow Survey (CFS), administered by the BTS Census Bureau, offers the most comprehensive analysis of American freight movements among various information providers. 

The CFS is the only provider of nationwide statistics on domestic cargo transports by mining, manufacturing, selected, and wholesale retail industries over all transport modes. It is also the sole source with exhaustive statistics on imports of household dangerous products. As part of the economic survey, the CFS gets conducted once every five years.

The CFS offers regional forecasts for overall freight transport across seven distribution modes and 42 category groupings for 132 regions in the FAF (Freight Analyses Framework). The CFS provides approximately 2/3 of the FAF 's measurement value and tonnage. The residual freight is calculated on the basis of many widely accessible data sources, like the BTS Transboundary Freight Report, including information on freight movements around the U.S. borders. The FAF puts the statistics together in a five-year period sequence based on the yearly projections of the CFS and on 30 year predictions.

The FAF is focused, as far as possible, on observable data, but it depends on templates and inferences to cover the remaining information gaps in the 5-year assessments. Benchmark data limitations involving extensive analysis cover farmers' exports, urban solid waste transportation and domestic international trade transports. Although freight movements within U.S. external gates and abroad are constantly monitored, movements of international trade among gateways, domestic sources for exports and local destinations for imports have not been calculated since the 1970s.

Inflation-adjusted terms have increased the value of commodities trading by 54 per cent since 2003, and the movement of these goods in the U.S. pressures on local transportation networks for all types of transport. For certain locations with major gateways and ports, these internal movements of foreign exchanges can be high enough to substantially add to pollution and impact the foreign competitiveness of local economic growth.

Although the FAF offers the full image of freight transport at regional (from and to 132 regions) and national levels, there are not many local programs for collecting information on local cargo movement, which is necessary to recognize and support ‘the last mile’ of freight transport. Local freight movement is mainly influenced by important modifications in the cargo network with the deployment of new delivery technologies and strategies of distribution, and the growing proliferation of online shopping.

New strategies for data collection may be needed to identify future changes in freight movements caused by the usage of retail stores, small distribution centers, e-commerce, improvements of supply chain networks, the usage of robotic systems in the air and on the ground for local delivery, and economic developments across regions and market sectors.

The FAF tracks traffic across countries, but shipping decisions are focused on other considerations than geography including their specific supply chains' expense and logistical standards. In addition, case studies are the source of knowledge about other supply chains. Supply chains range widely from one industry to another and can be particular to individual companies.

Issues on ownership have impaired the capacity of public authorities to understand and study the decisions of carriers and shippers that affect the movement of items and the operation of freight transport systems.

Transportation Contributes The Major Part Of American Economy

Transport economics

In the American economy, transport has 2 key roles: it facilitates economical activity and represents one of the major economic activities. The transport of individuals to their places of consumption and work, and of goods from suppliers to consumers over short and long distances leads to an increase in the various markets. Transport makes it possible to operate and grow a large economy.

The transport sector is equally relevant with regards to government and private expenditures for transport systems, infrastructure, and facilities. The government, businesses, and households directly consume transport goods, including services (commercial aviation), and vehicles. Transport also contributes significantly to balancing payments through activities such as aircraft exports.

Transportations' economic position is calculated by figures on household and company spending on transport infrastructure, workers and occupations in the transport sector, as well as the contribution to gross domestic product (GDP) by the transportation industry. Such statistics are given by the Census Bureau, the BEA, and the Labor Statistical Bureau, each of them considering transport as a major business field. Based on these statistics, the BTS is developing satellite accounts for the true economic contribution of transport.

Transport for hire is one of the various economic survey sectors carried out every five years. The Census Bureau 's Annual Services Report also covers this sector and gathers operating profits and other statistics specific to the industry. The BEA uses these details for an estimation of spending movements within economic sectors.

The BTS extends the substantial contribution to the economy by offering in-house transport facilities within a non-transportation sector, such as truck-fleets run by major supermarkets and supermarket stores, through its Transportation Satellite Accounts. In fact, BTS measures the economic benefit to private travel above the normal GDP accounting.

Due to the fact that the transportation sector is not frequently underlined in the national economic data, the monthly Transportation Services Index (TSI) was developed by the BTS. It is used to offer a perspective on transport’s role in a dynamic economy. 

Furthermore, The BTS receives quarterly financial information from air carriers, including net earnings, total sales, operating expenses, airfare and luggage charges. These statistics give a better grasp on transport’s relationship with the current and future economic path.

The expense of delivering transport services and consumer pricing for using those services were reported by BTS. The costs of delivering transport services are based on the resources needed — work, equipment, infrastructure, and fuel. There’s little information on the cost and pricing of infrastructure building, even though plenty of information is available for transport services. 

The National Highway Transportation Cost Index (NHCCI) calculates the average increase over time in state transport prices of road building services and materials. The cost of construction affects the level of investment by the government in highways, bridges, and new roads.

The value of capital stock and transportation infrastructure investment and other assets will also be published by the BTS. That represents the total investment of the American portfolio of transport capital, public and private investments on roads and other existing infrastructure systems, as well as household expenditures on safe transport products.

There are two highly acute weaknesses in the understanding of the economy and transport. First of all, statistics on the expense of moving items is not properly understood. Failure to provide cost information prevents policy development that incorporates the price of transportation for companies and consumers in transport planning and policy decisions. 

Second, the balance between government income and government expenditure is typically determined by traditional public investment where the income that’s collected is used to pay for investments. This becomes more complicated due to borrowing. 

The degree of financial responsibility of public-private agreements in the program can require a totally different accounting scheme. Standard statistics, just like returns on investments, can hardly be estimated without accurate accounting. The BTS is developing a roadmap to enhance and expand the financial information series on transport in the early stages.

There Are A Lot Of Safety Increasing Key

Safety

Fatality, death, and collision metrics are commonly used to measure travel safety. As described below, these metrics are useful system state indicators. However, additional data on human factors, transport infrastructure, and equipment safety features is necessary to help ensure travel safety.

Safety is the main priority of DOT’s major predictive initiatives. Nearly 40% of investments in statistical programs are routed towards the FMCSA (Federal Motor Carrier Safety Administration) and the NHTSA (National Highway Traffic Safety Administration). The FHWA and PHMSA are also implementing large-scale safety programs. A major aviation-industry security data exchange program is sponsored by the FAA, and security data programs conducted by the FTA and FRA are expanding. Overall, the Department’s annual cost for safety statistics exceeds $50 million spread along its operational administrations.

The DOT develops emerging forms of intelligence and innovative research approaches to fully grasp protection threats in relation to long-standing safety information initiatives. The Safety Information Program includes several DOT test projects for incorporating and evaluating broad data collections that have not previously been utilized for risk assessments, like real-time data sets in the private sector, including Waze. Originally, it focused on road safety as road travel is the main source of accidents and injuries. 

Another aspect of the Safety Data Initiative is the Solving for Safety Visualization Challenge in which members generate creative methods for visual analysis to obtain insights on collisions and improve transport safety.

A combination of information on the driver’s condition, the circumstances underlying each accident, and the consequences of the accident should provide a holistic approach to safety issues. For highways, it remains difficult to integrate police reports, crashing investigations and health records that hinder a robust comprehension of the risk factors, and optimal responses to them.

The relatively lower fatality rates on commercial transit, rail, aviation, pipeline, and waterborne transport in comparison to highway fatalities does not minimize the requirement for information to identify the dangers and to protect or increase the safety of these transport modes. The statistics for these modes focus on more than just the determination of sources for unusual accidents, but also on recognizing the underlying conditions of various mishaps or near misses that would have caused a serious crash.

The BTS has developed a private close call monitoring system that enables companies and individuals to report misses without any fear of reprisals in order to identify safety issues and develop data to mitigate those problems. The Confidential Information Protection and Statistical Efficiency Act guarantees the confidentiality of the respondents. 

This jurisdiction is used by the Washington Metropolitan Area Transit Authority to gather information on near-misses of its bus and rail operations, while the Bureau of Safety and Environmental Enforcement of the United States’ Department of the Interior utilizes this system for offshore oil extraction near-misses.

This Information Is Used For The Quantification Of Transport Related Ambient Noise Emission In Environment

Energy and the environment

Energy measures and transport effects on the environment encompass energy products as the origin of demand for the transport of freight (e.g.: the movement of natural gas through pipelines and coal movement by railroad), the quantity and cost of the energy required by every mode of transport, and the number of vessels and vehicles by energy source or type of fuel. Many measures are dictated by the Energy Information Administration. In addition, the BTS publishes data on transport noise.

The report provides an analysis of the pollution produced by traffic on all airports and highways at a regional level. This information is used for the quantification of transport-related ambient noise emission.

The energy efficiency of transport is usually measured in miles per gallon, and if it is possible, it’s measured as passenger per miles & ton per miles per British thermal unit. It’s done in order to better represent the efficiency of the system by encompassing load factors as well as rates of vehicle occupancy.

Unfortunately, annual rates for vehicle occupancy are not accessible, and there is also a shortage of accurate information on freight load factors. Data on car occupancy rates are available through infrequent surveys (e.g.: The NHTS). Real occupancy rates are rare, costly, and vaguely comprehensive. To help understand the propensity to share travel and thereby reduce the demand for vehicle travel, The BTS aims to produce innovative means for collecting vehicle occupancy data.

While different agencies collect information to satisfy particular needs, incorporating this data in many disciplines and developing analytical technologies are the keys to ameliorating various impacts as well as energy efficiency factors related to mobility. For instance, the ties between the intensity of energy usage and the patterns of vehicle usage are crucial.

BTS works with various federal partners on the re-introduction, not carried out since 2002, of the VIUS (Vehicle Inventory and Use Survey). Their findings will provide information on the deployment of driver assistance technologies, on the input to cargo demand models for traditional applications – including studies on vehicle weight and size, and to monitor the economic activities executed with motorized vehicles.

In the shipment of ethanol, crude petroleum, and various hazardous cargo, safety and energy concerns arise. As a response to the FAST Act of 2015 (Fixing America’s Surface Transportation), the BTS collaborated with the Association of American Railroads to assess the usage of tank cars to hold such risky commodities - distinguishing certain fuel cars that follow modern requirements from those which haven’t been upgraded or were switched over to non-hazardous operations. The BTS keeps supplying statistical information through the annual report including data on retrofits and planned construction of existing tank cars in agreement with modernized standards.

New data types to measure transport

New technology is developing an environment full of satellite intelligence, mobile phones, road traffic systems, ship monitoring systems, and “smart gadgets” in houses, cars, and places of employment. While information is collected from numerous new sources, data use methods and access are much less advanced than the traditional world of administrative records and surveys. Data is used accurately and intelligently.

Some data can only be gathered by posing questions to shippers, providers of transport services, or travelers through various surveys. However, increased costs, declining response rates, privacy and accommodation protections for information, and respondent burden transform surveys into a mere alternative for collecting data, as opposed to being the main choice.

Data Collection Methods And Sources To Measure Transport

Data collection methods and sources outside of surveys are:

  • Records of the administration which include car registry databases and police reports for highway crashes;
  • Engine monitors for estimating fuel economy, geo-position reports made by mobile phones to enable travel tracking and by transponders for tracking aircraft and ships, sensors like the traffic-counting motorway rubber hoses;
  • Imagery, like satellite photos and cameras for monitoring traffic;
  • Multitude sourcing for the tracking of highway network changes, such as Waze or Open Street Map;
  • Web mining for consumer product costs (e.g. the Billion Prices Project).

Although these data methods and sources are highly promising, the accessibility of information alone does not ensure that robust data is available to respond to the decision makers’ questions. In general, technology-based statistics deliver narrower windows of measured phenomena than surveys, giving an advantage to statistical representation and data integration. 

Major confidentiality, intellectual property, and privacy issues are equally raised by new technologies. Significant issues of quality, the usage of inadequate methods in the analyzing of data to deliver effective data, and even confidentiality matters can impact the efficacy of the generation of accurate public statistics. The quality of data is crucial since every dataset is prone to mistakes.

Sensors can be either broken or poorly calibrated. Administrative reports may be flawed. They may present duplicates of names and incompatible types of data for some individuals. Range limitations may prejudice the resulting reports.

Statistical authorities have well-established and extensive methods to identify and control data errors in well-designed example statistics, but methods for handling data errors in external sources are less well-developed. Some error sources in statistics from alternative sources are comparable to the errors resulting from surveys.

Different error sources can require specific detection and correction strategies. When data from multiple sources is combined for an evaluation, the difficulty is greatly increased.


Share this content on social media for a chance to get up to 20% off your next shipment.
Copy link

Joe Webster always knew the auto transport industry would be a great career option. And with decades of experience, Joe is now an established consultant for A1 Auto Transport.

Joe was born in Santa Cruz, California. During high school, Joe worked as a mechanic; a job continued to work part-time during his bachelor's degree.

Email Me


Testimonial
Mylene Rutllant
It’s my number one pick in auto shipping to this day.
★★★★★

...my choice in terms of auto transport has to be A1 Auto Transport. It’s in the name, but also in the quality with which they do their jobs. I’ve never had a problem with this company.

Testimonial
Luis Rodriguez
You have my full support and recommendation!
★★★★★

A1 Auto Transport... From the get go, they were very different from my past options. Their website was very professional and up to date, full of useful information. I requested a quote using their online form, and I got an email response within an hour. Surprisingly fast!

Testimonial by Cristine Benoit
Cristine Benoit
I can safely say this is a legit company that will get the job done.
★★★★★

There are a lot of options for auto transport these days, which surprisingly makes it harder to find a good company. I received more than 10 offers to ship my car, but I couldn’t decide on any of them... Fortunately, I made the right choice with A1 Auto Transport.

Testimonial
David Osallo
We give A1 Auto Transport a big 10 out of 10!
★★★★★

We give A1 Auto Transport a big 10 out of 10! We chose them to move our car from California to Vermont, since we needed professionals.

Visit our social, and see what our clients are saying about us:

Ship Your Vehicle With A-1 Auto Today
Get an instant free Quote Now

Or Call Us Today and Speak Directly to Our Sales Team:

Call Us 1-888-230-9116

Our Partners:

Better Business Bureau Accredited
FMCSA Member
INC. 500 Member
VeriSign Secured
AMSA Member

A-1 Auto Transport is a disclosed agent for the following shipping companies:

CSI Logistics
435 Division Street
Elizabeth, NJ 07201
FMC 22206
Intl Cargo
45 Campus Drive
Edison, NJ 08837
NO. 17858N
Trans Global Auto Logistics, Inc.
3401 E Randol Mill Rd,
Arlington, TX 76011
NO. 018191NF
CFR Rinkens
15501 Texaco Avenue
Paramount, CA 90723
NO. 013055NF
ABC Worldwide LLC
2840 NW 2nd Ave #105
Boca Raton, FL 33431
NO. 025472F
ShipYourCarNow LLC
1160 South Rogers Circle Suite 1
Boca Raton, FL 33487
NO. 025646
Merco Air & Ocean Cargo, Inc.
6 Fir Way
Cooper City, FL 33026
NO. 021869F
Copyright © 1988-2024, A-1 Auto Transport - All Rights Reserved.